Client:
Shell
My Role:
Product Designer
Year
/23
Service Provided:
UX Design, UI Design
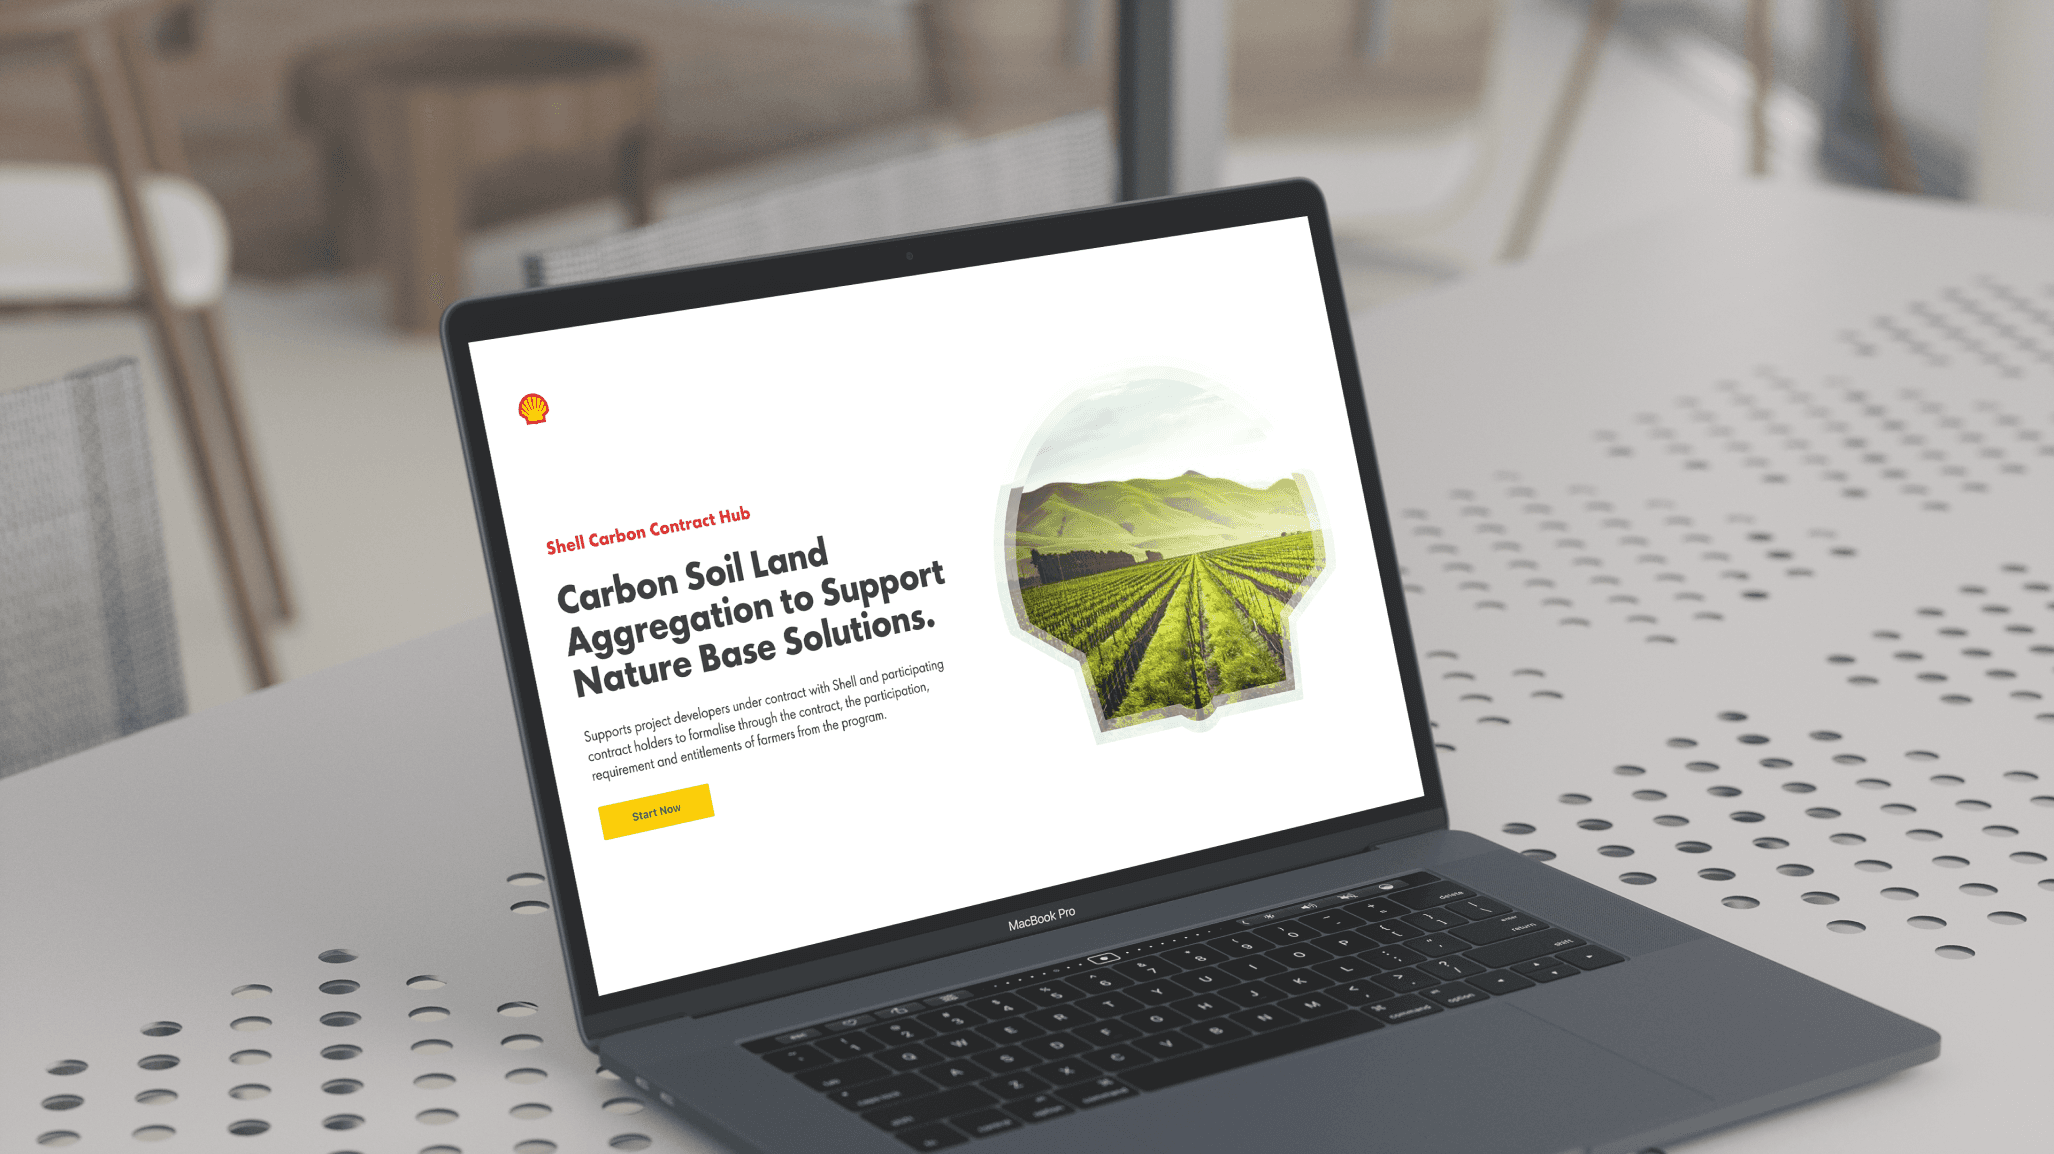
The Background
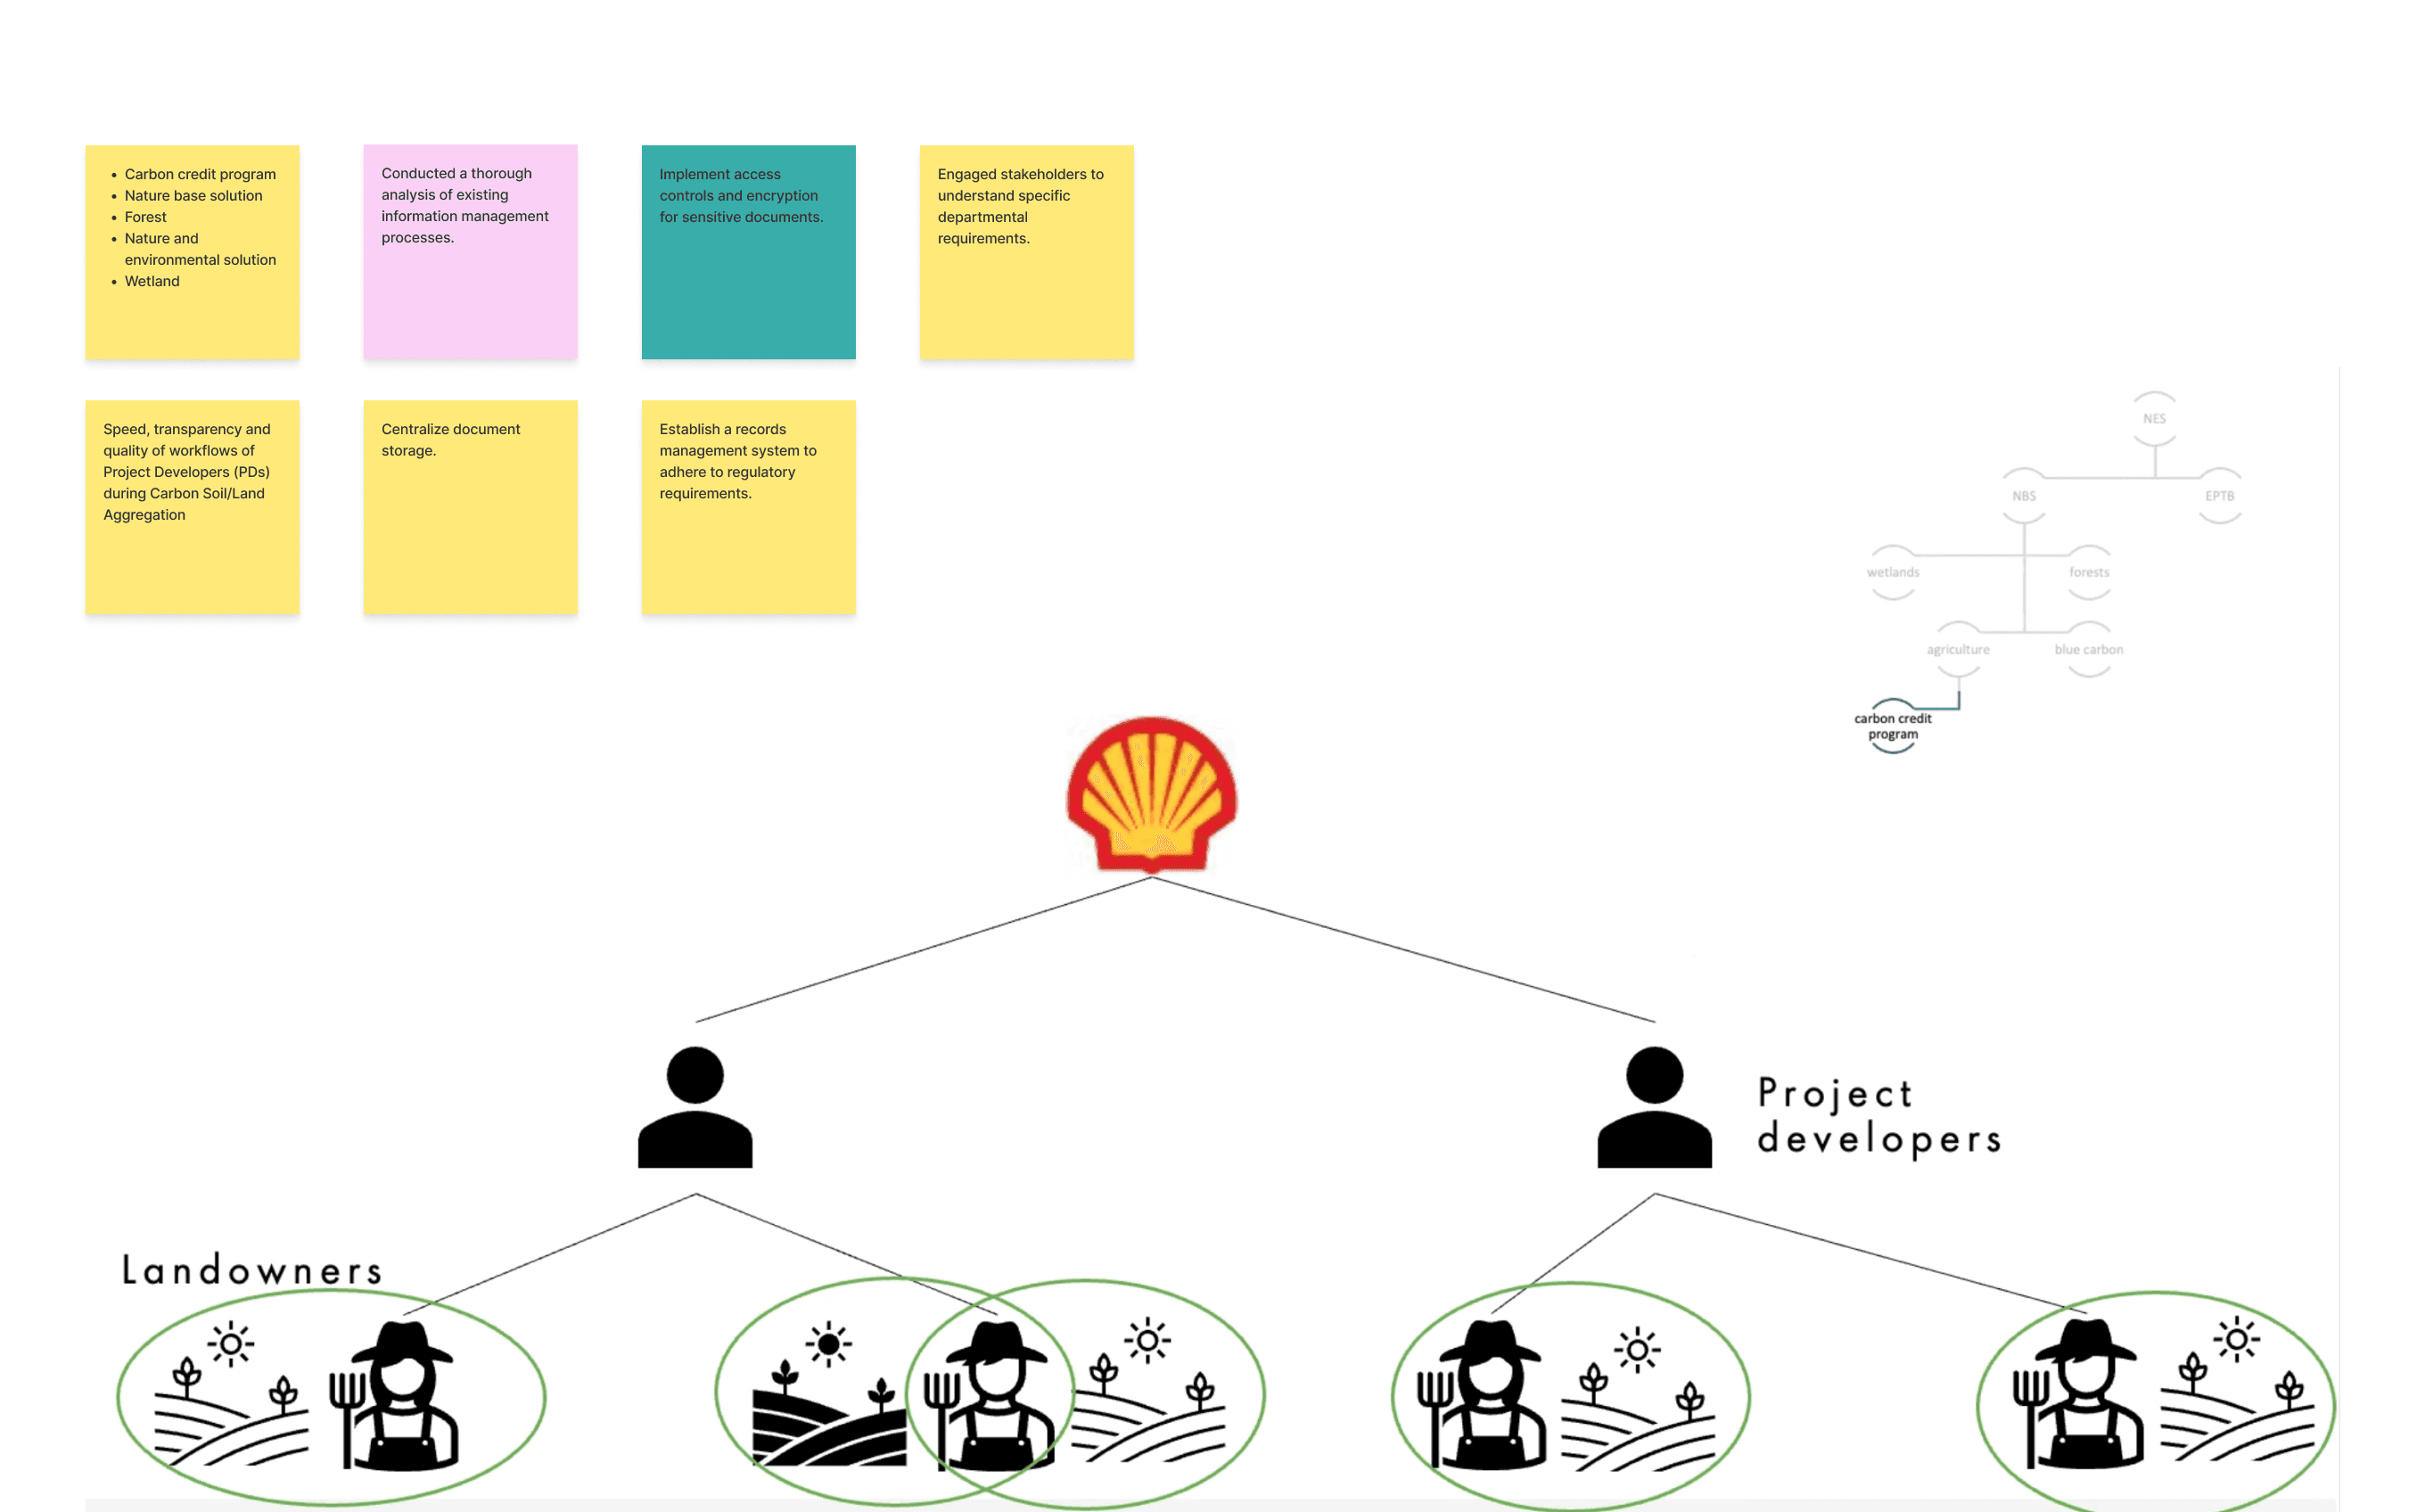
The carbon program which is a part of nature and environmental solution arm of Shell faced challenges in efficiently managing and organizing critical information between land owners and project developers.
The Challenge
Speed, transparency, information management and quality of workflows of Project Developers (PDs) during Carbon Soil/Land Aggregation
The Goals
Research, strategise, design and test a digital platform to support the undertaking of aggregated carbon projects in the US and Implement a comprehensive document management System, under methodology VM0026.
Project Developers will register to use the platform with the aim of formalising through contracts their respective participation, requirements, and entitlements from the project.
This digital land aggregation platform will enable:
Individual landowners to gain access to the carbon offset market
Support project developers’ workflows with digital tools.
Streamline project operations.
Improve the efficiency of document approval workflows.
Integrate with existing systems to minimize manual data entry.
Streamlined approval processes, reducing turnaround times.

My Design Process
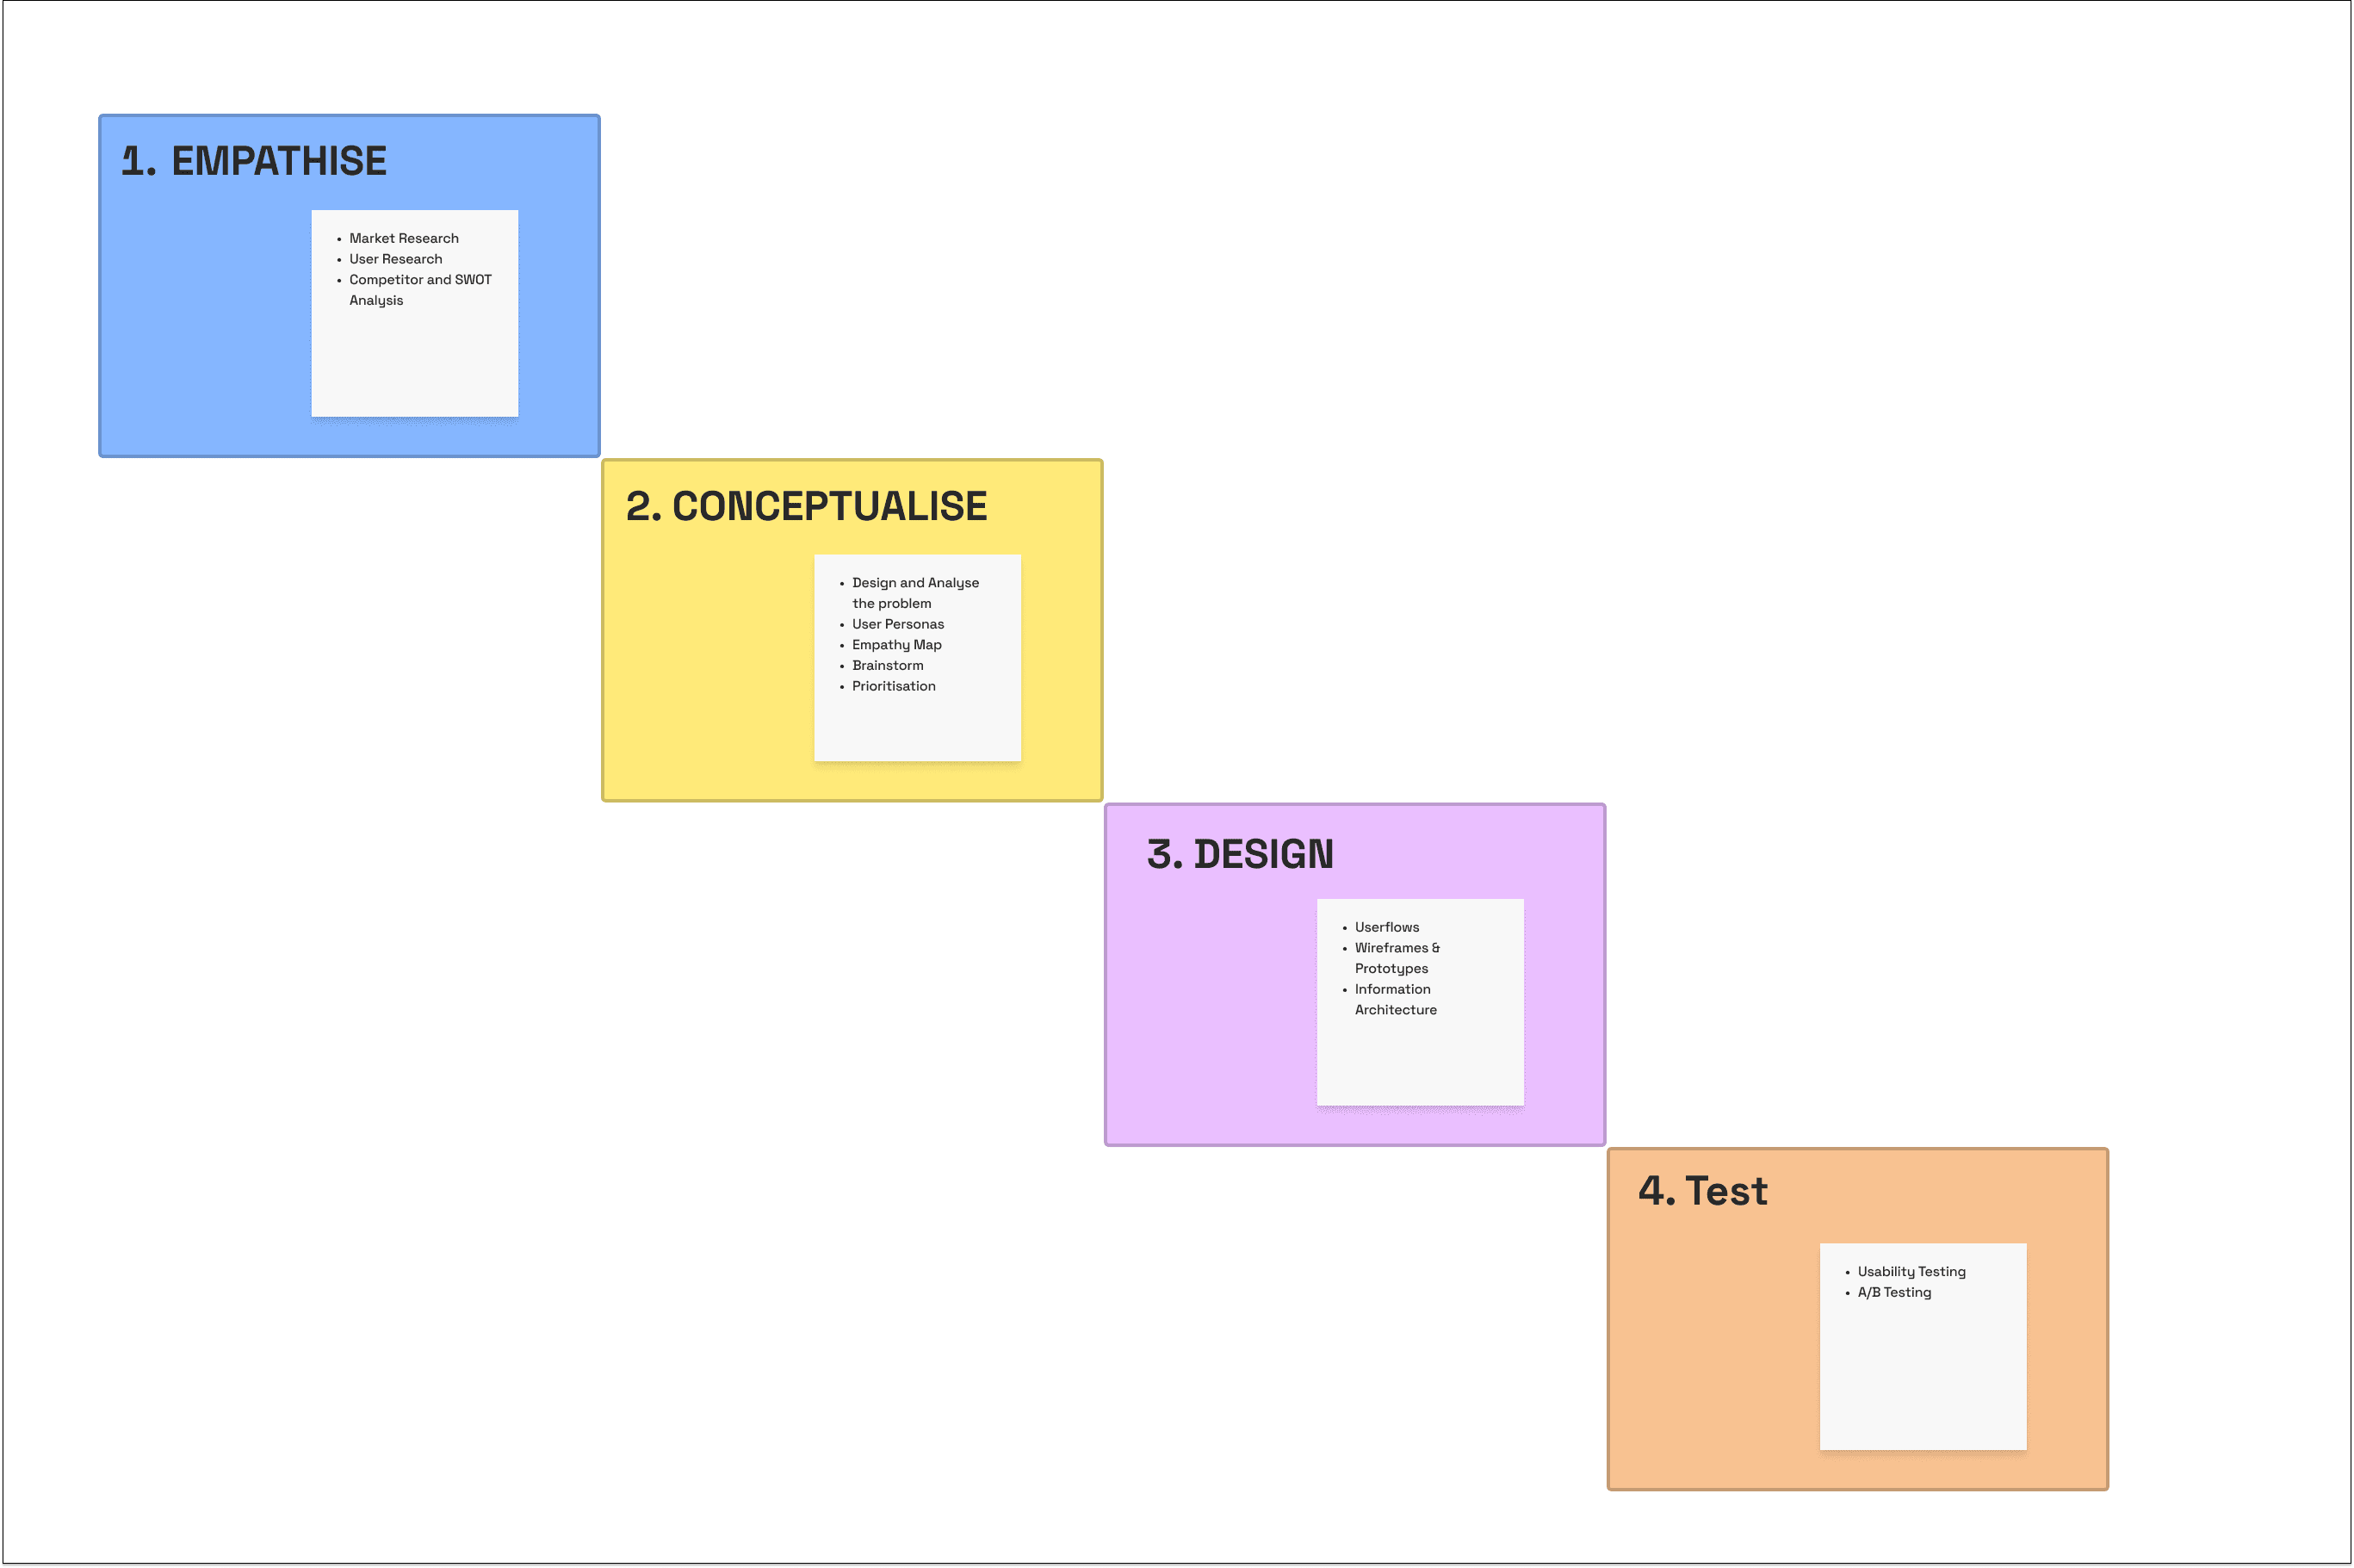
Research
I asked some helpful questions using the 4W1H principle: How did the problem arise? What was the history? Who are the users and what do you know about these users? Why is this problem important?
Also, to understand users wants, needs and expectations.
I Dived into an intensive 4-weeks research sprint.
Investigated forums and surveys
Organised focused group sessions with project developers
Interviewed 30 farmers from the US
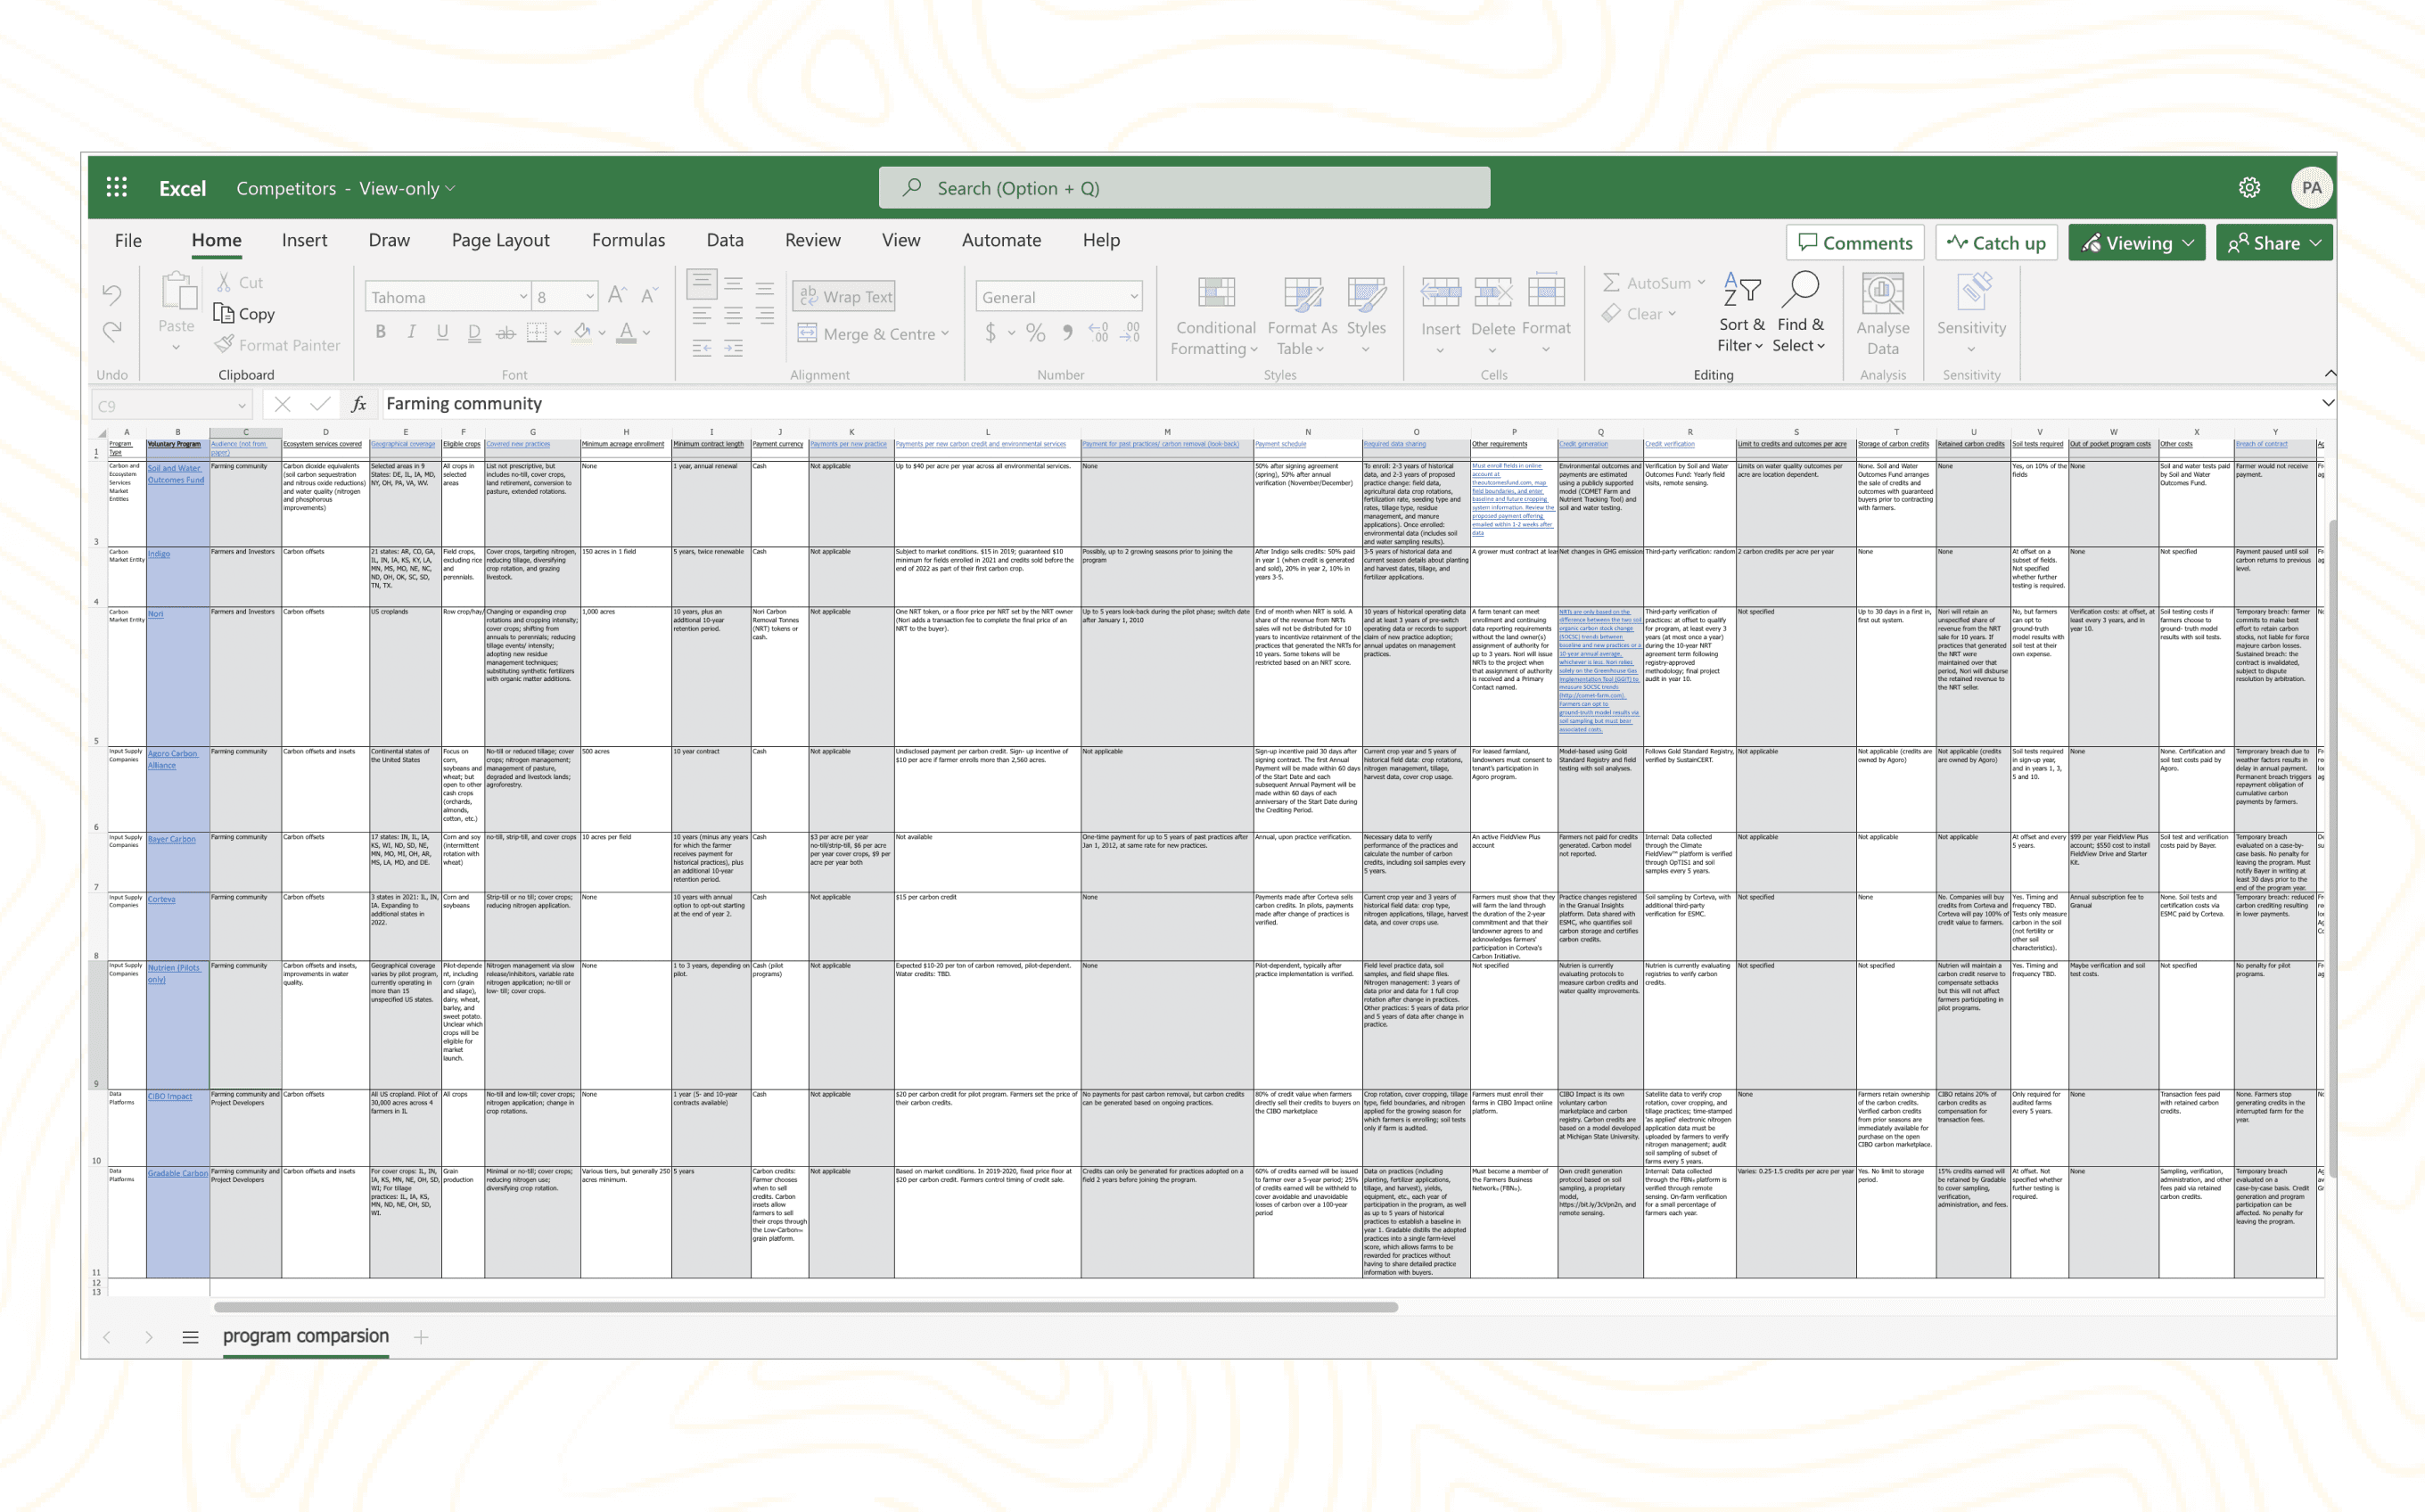
Competitive Analysis
Analysing competitors allows you to identify gaps in the market or areas where your design can differentiate itself. By understanding what your competitors are offering, you can identify opportunities to create a unique selling proposition (USP) or design solution that meets unmet customer needs.
SWOT Analysis

User Persona
I divided users into more refined groups of buyers based on selected characteristics using the following framework:
Demography(Age Group, Education, Gender)
Geography(Urban, Rural)
Psychography(Personal Attribute)
Behavioural Patterns(Buying Behaviour)

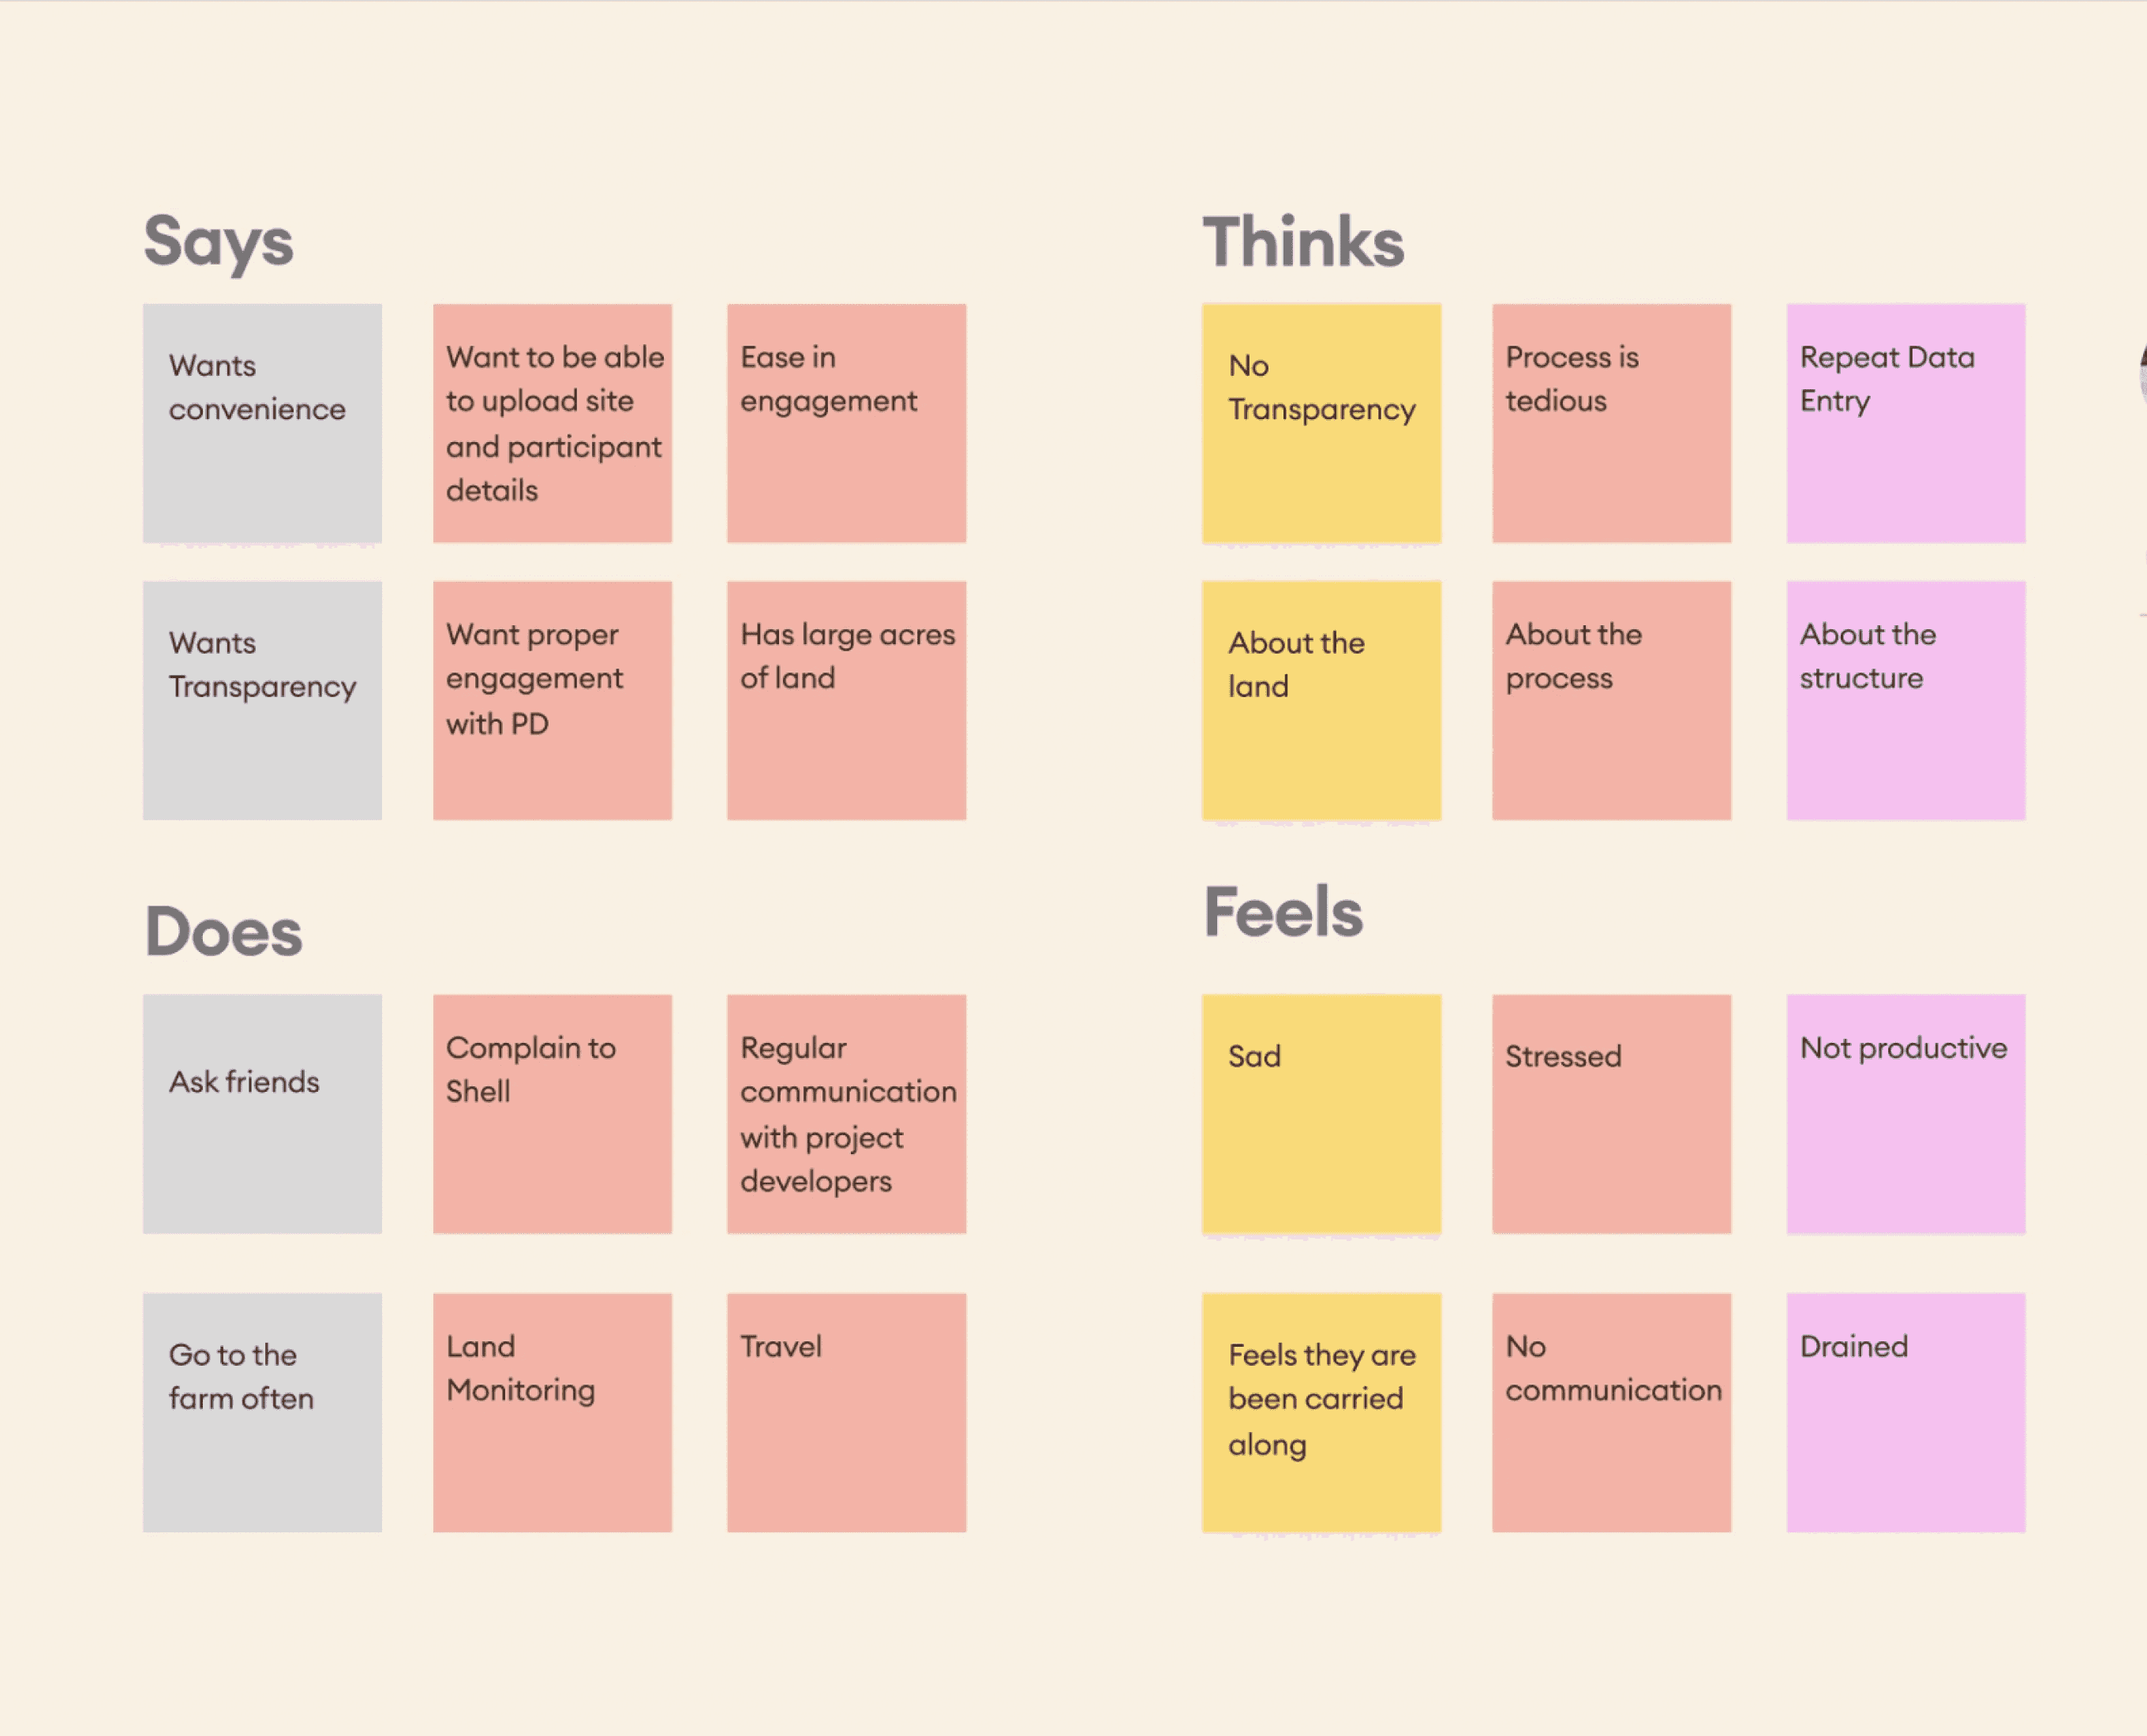
Empathy Map
An empathy map is a collaborative visualisation used to articulate what we know about a particular type of user. It externalises knowledge about users in order to create a shared understanding of user needs, and aid in decision making
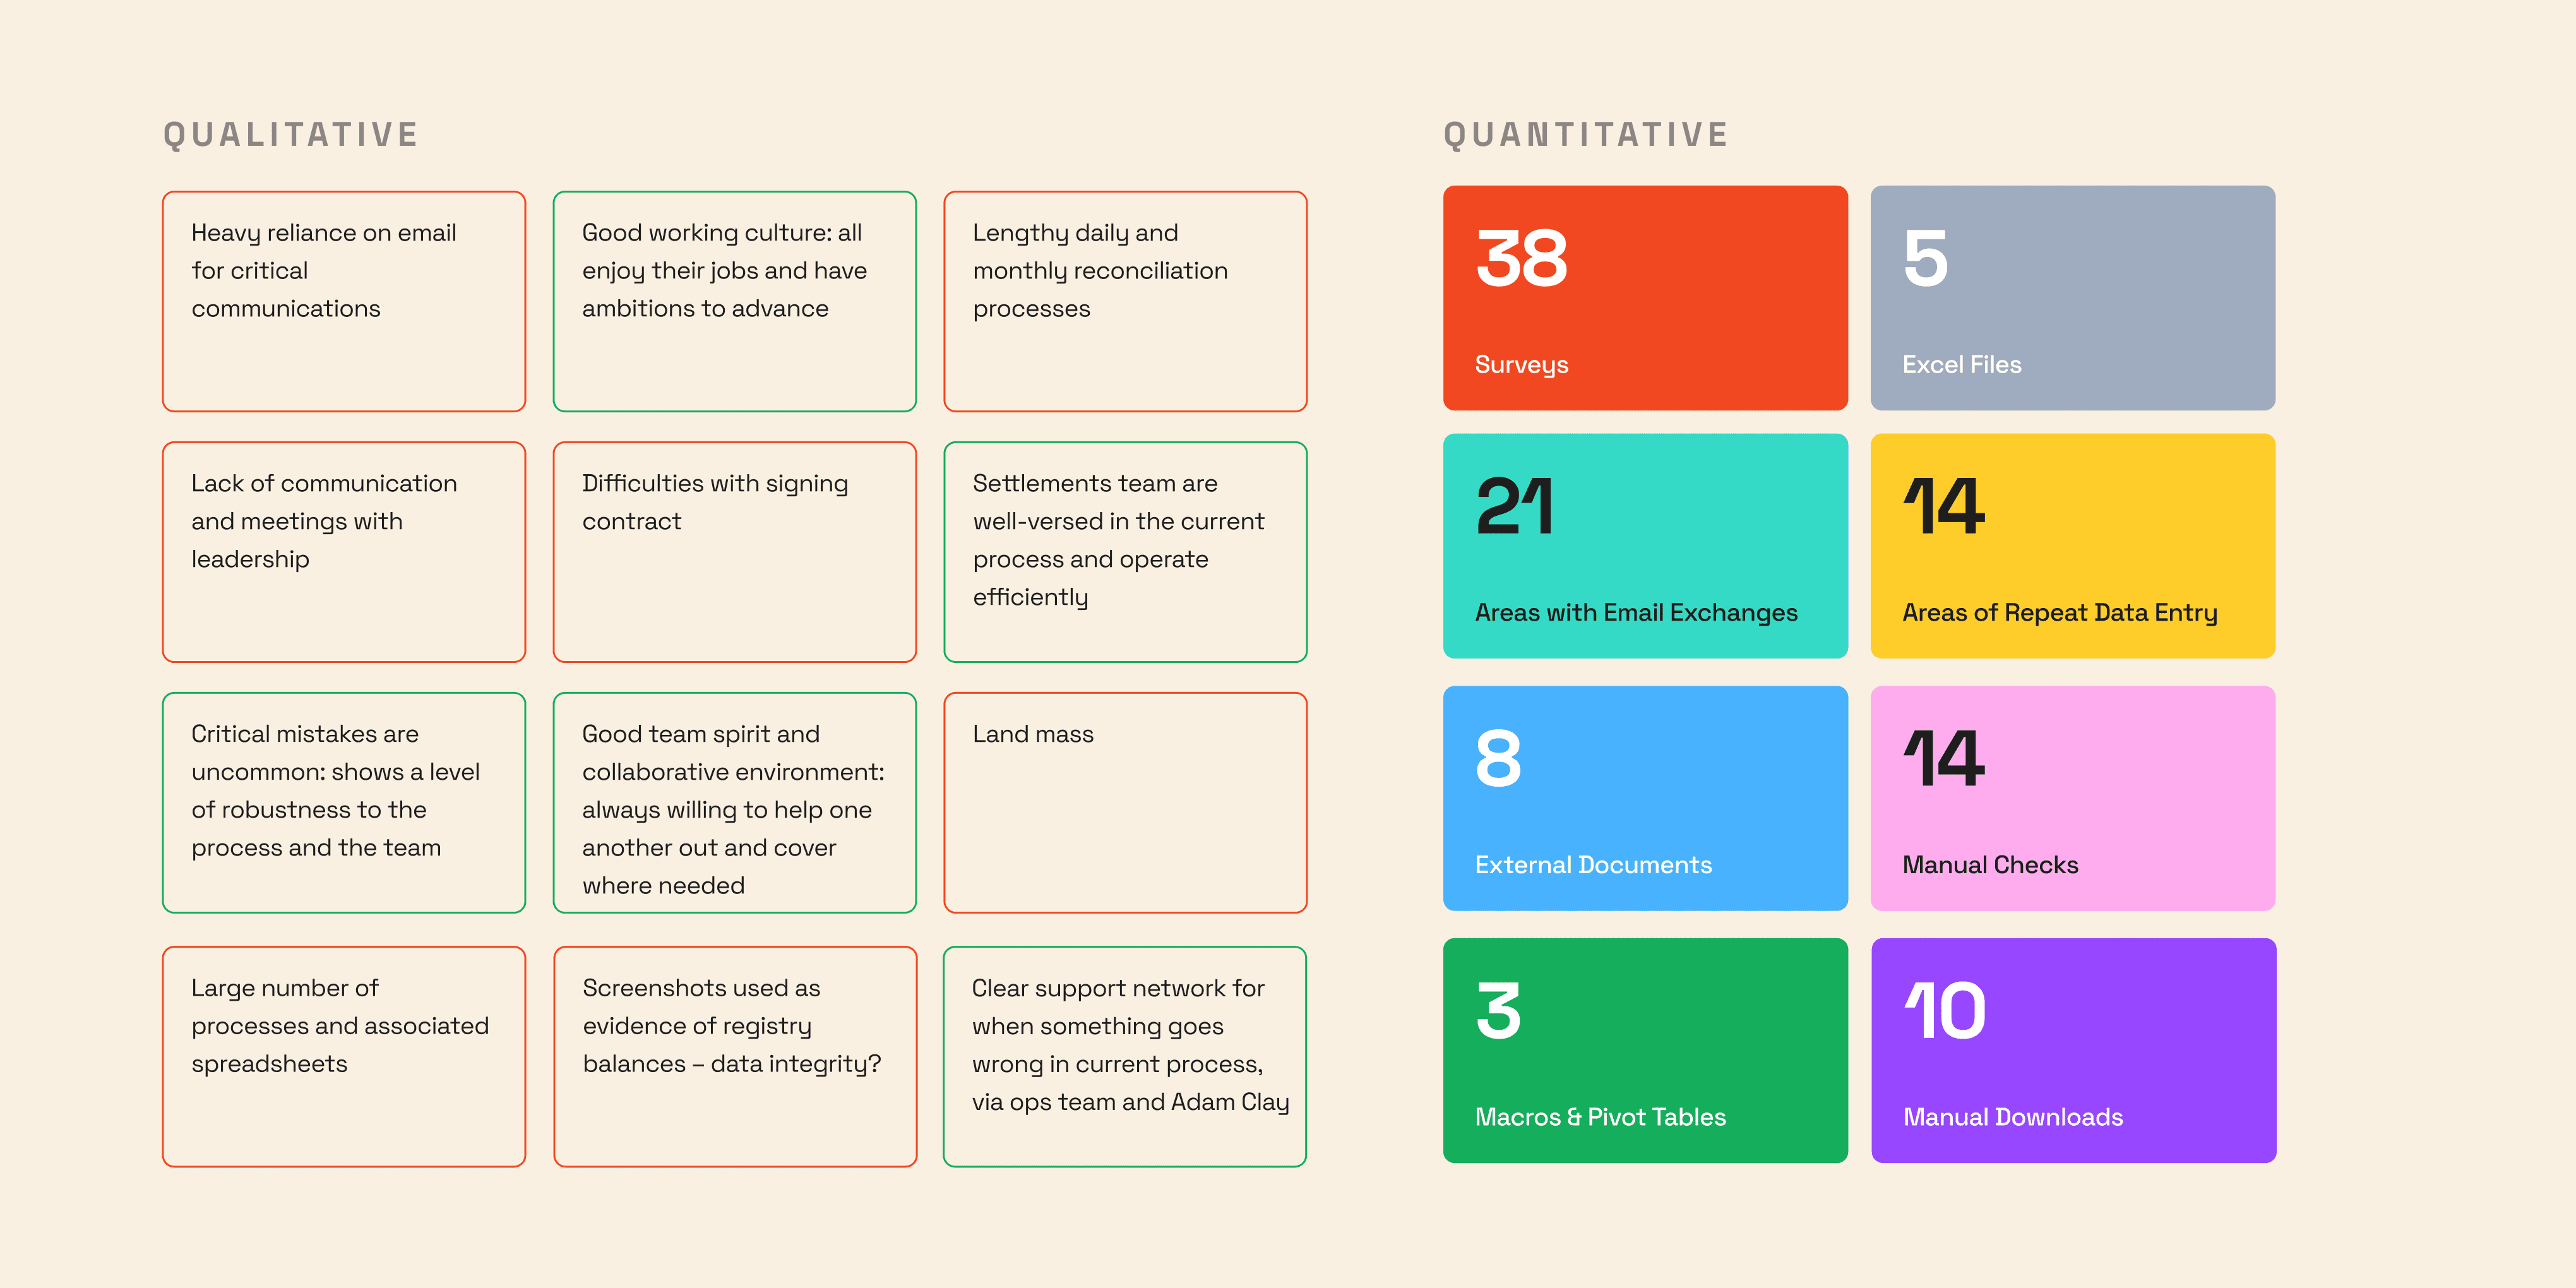
Key Findings
An empathy map is a collaborative visualisation used to articulate what we know about a particular type of user. It externalises knowledge about users in order to create a shared understanding of user needs, and aid in decision making
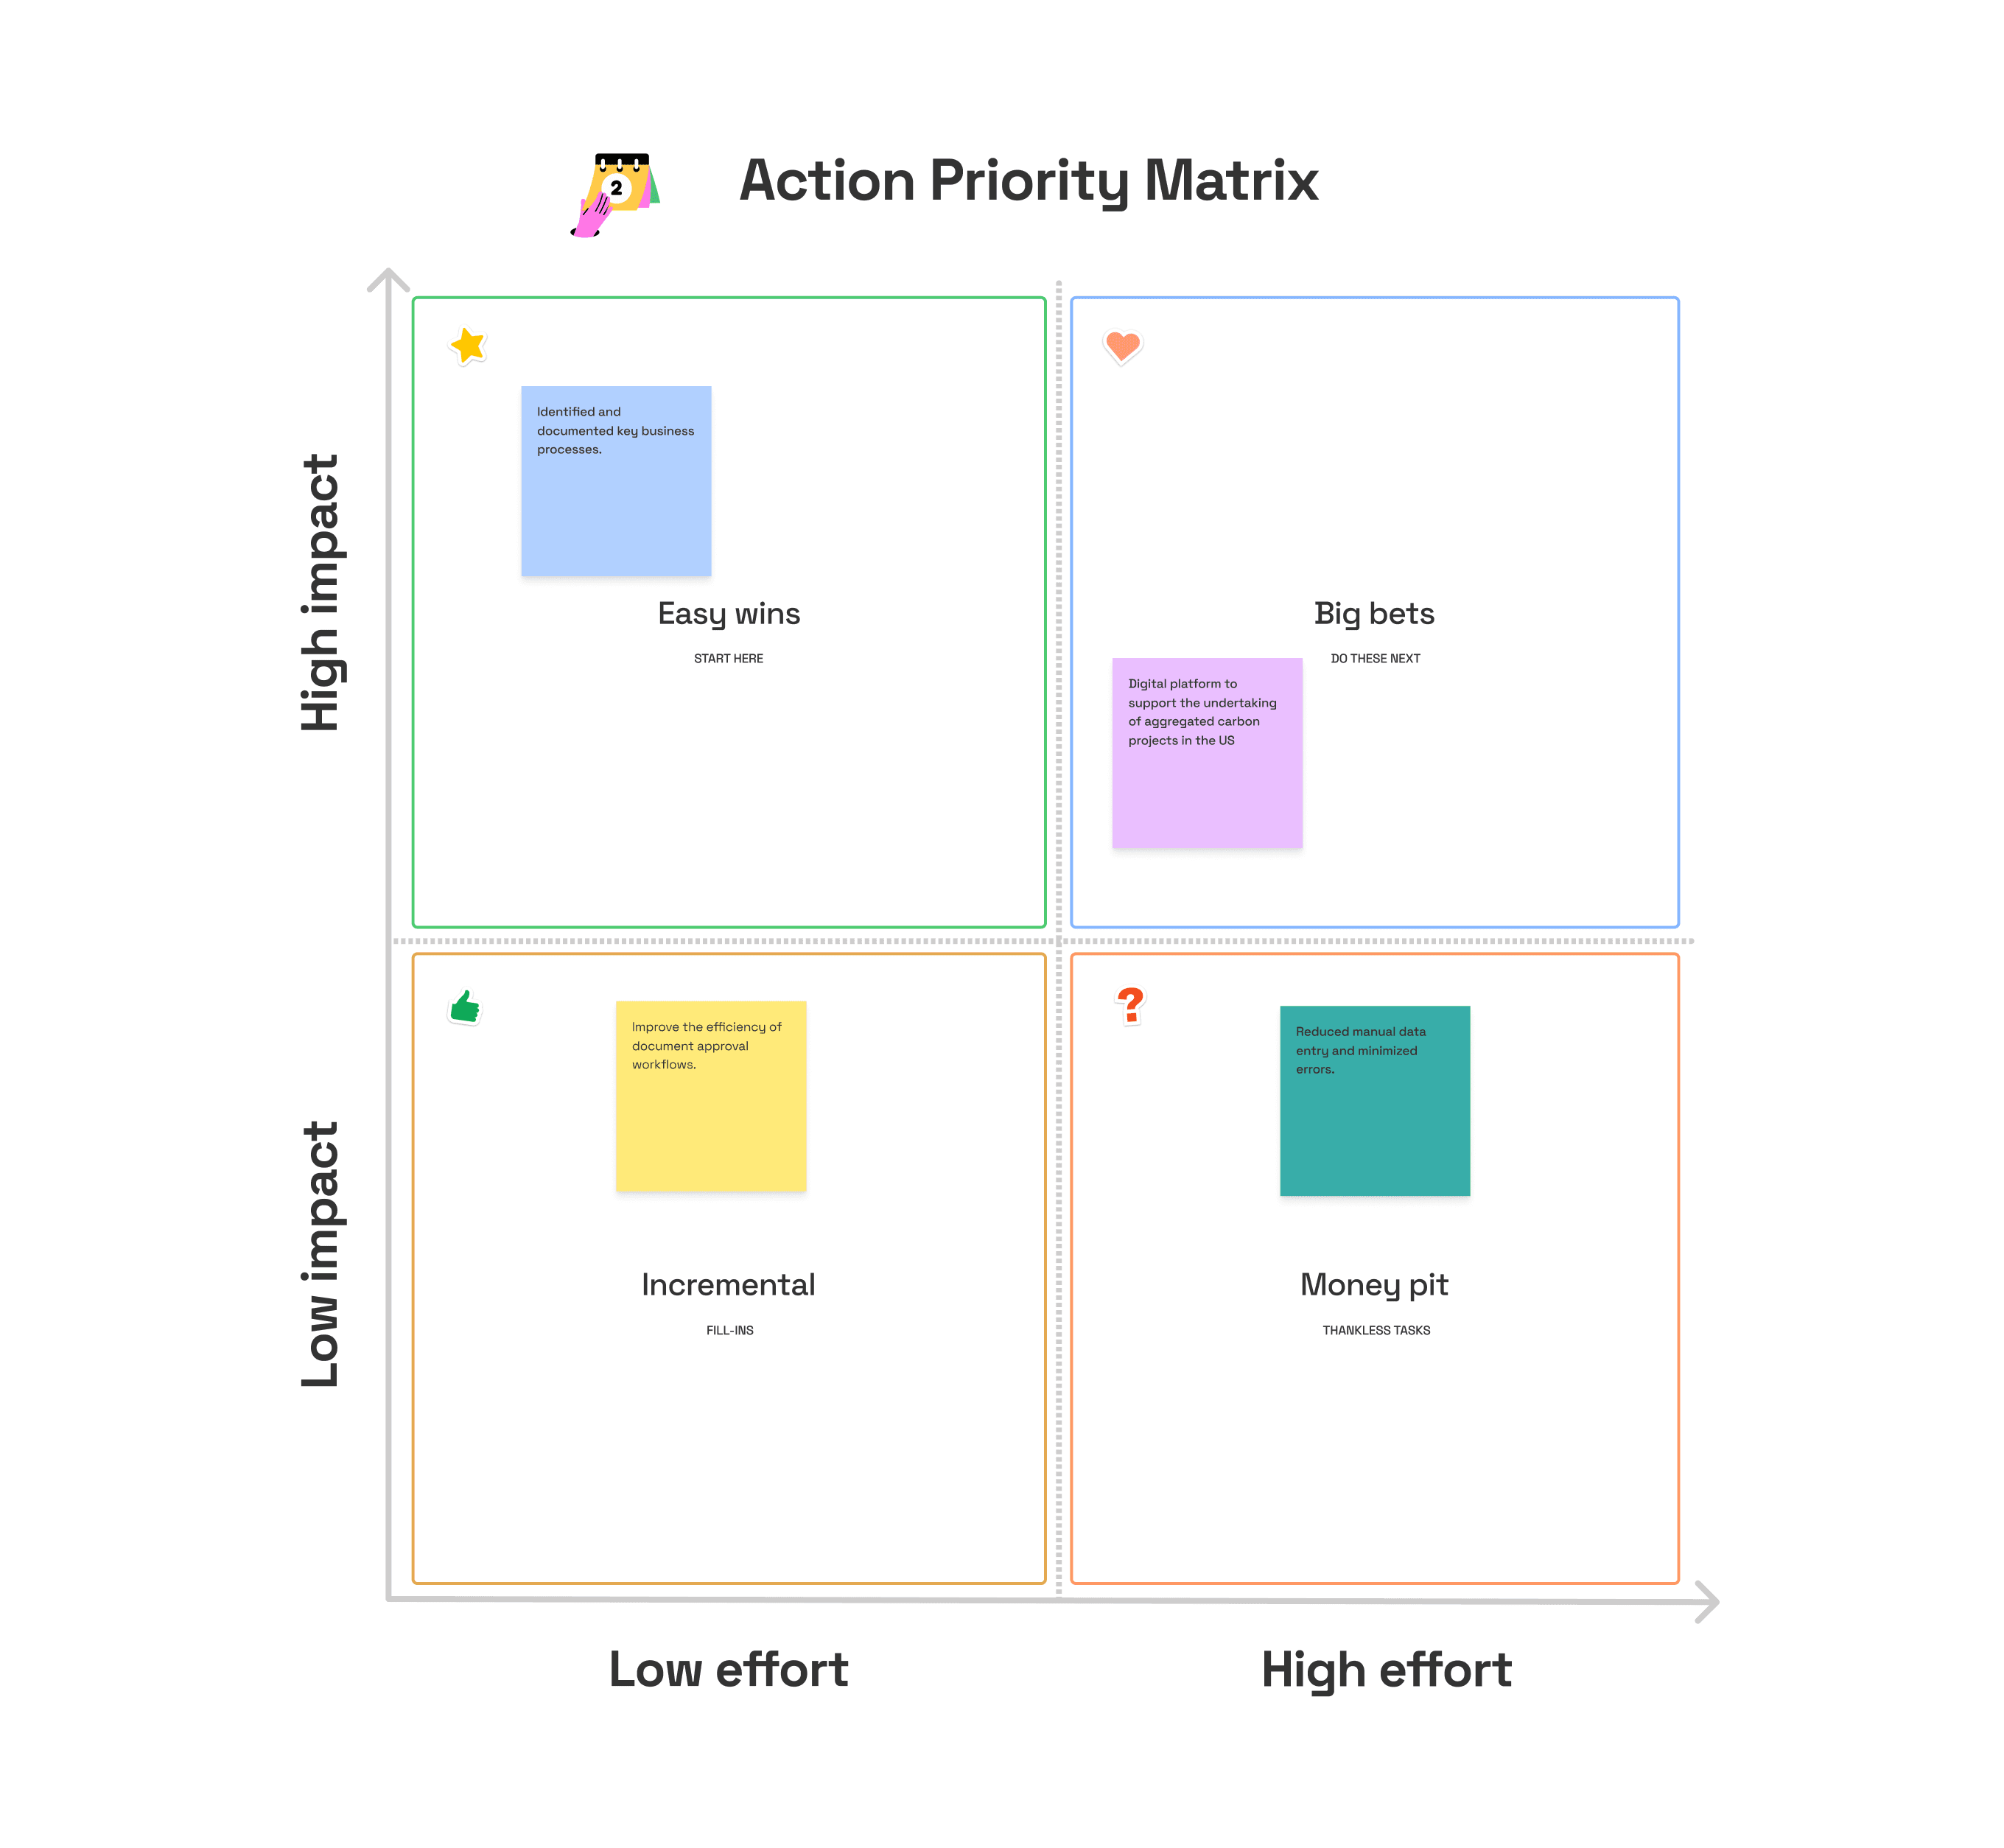
Brainstorming and Prioritisation

Understand key pain points, wants and needs
Produced a vast array of ideas and draw links between them to find potential solutions.
Define the objective and Categorised findings (Codes and themes)
Synthesise findings by turning findings to insight, using the “How might we” approach
I then narrowed down the ideas to 3 ideas with high impact and high effort
Present synthesis to stakeholders
Information Architecture
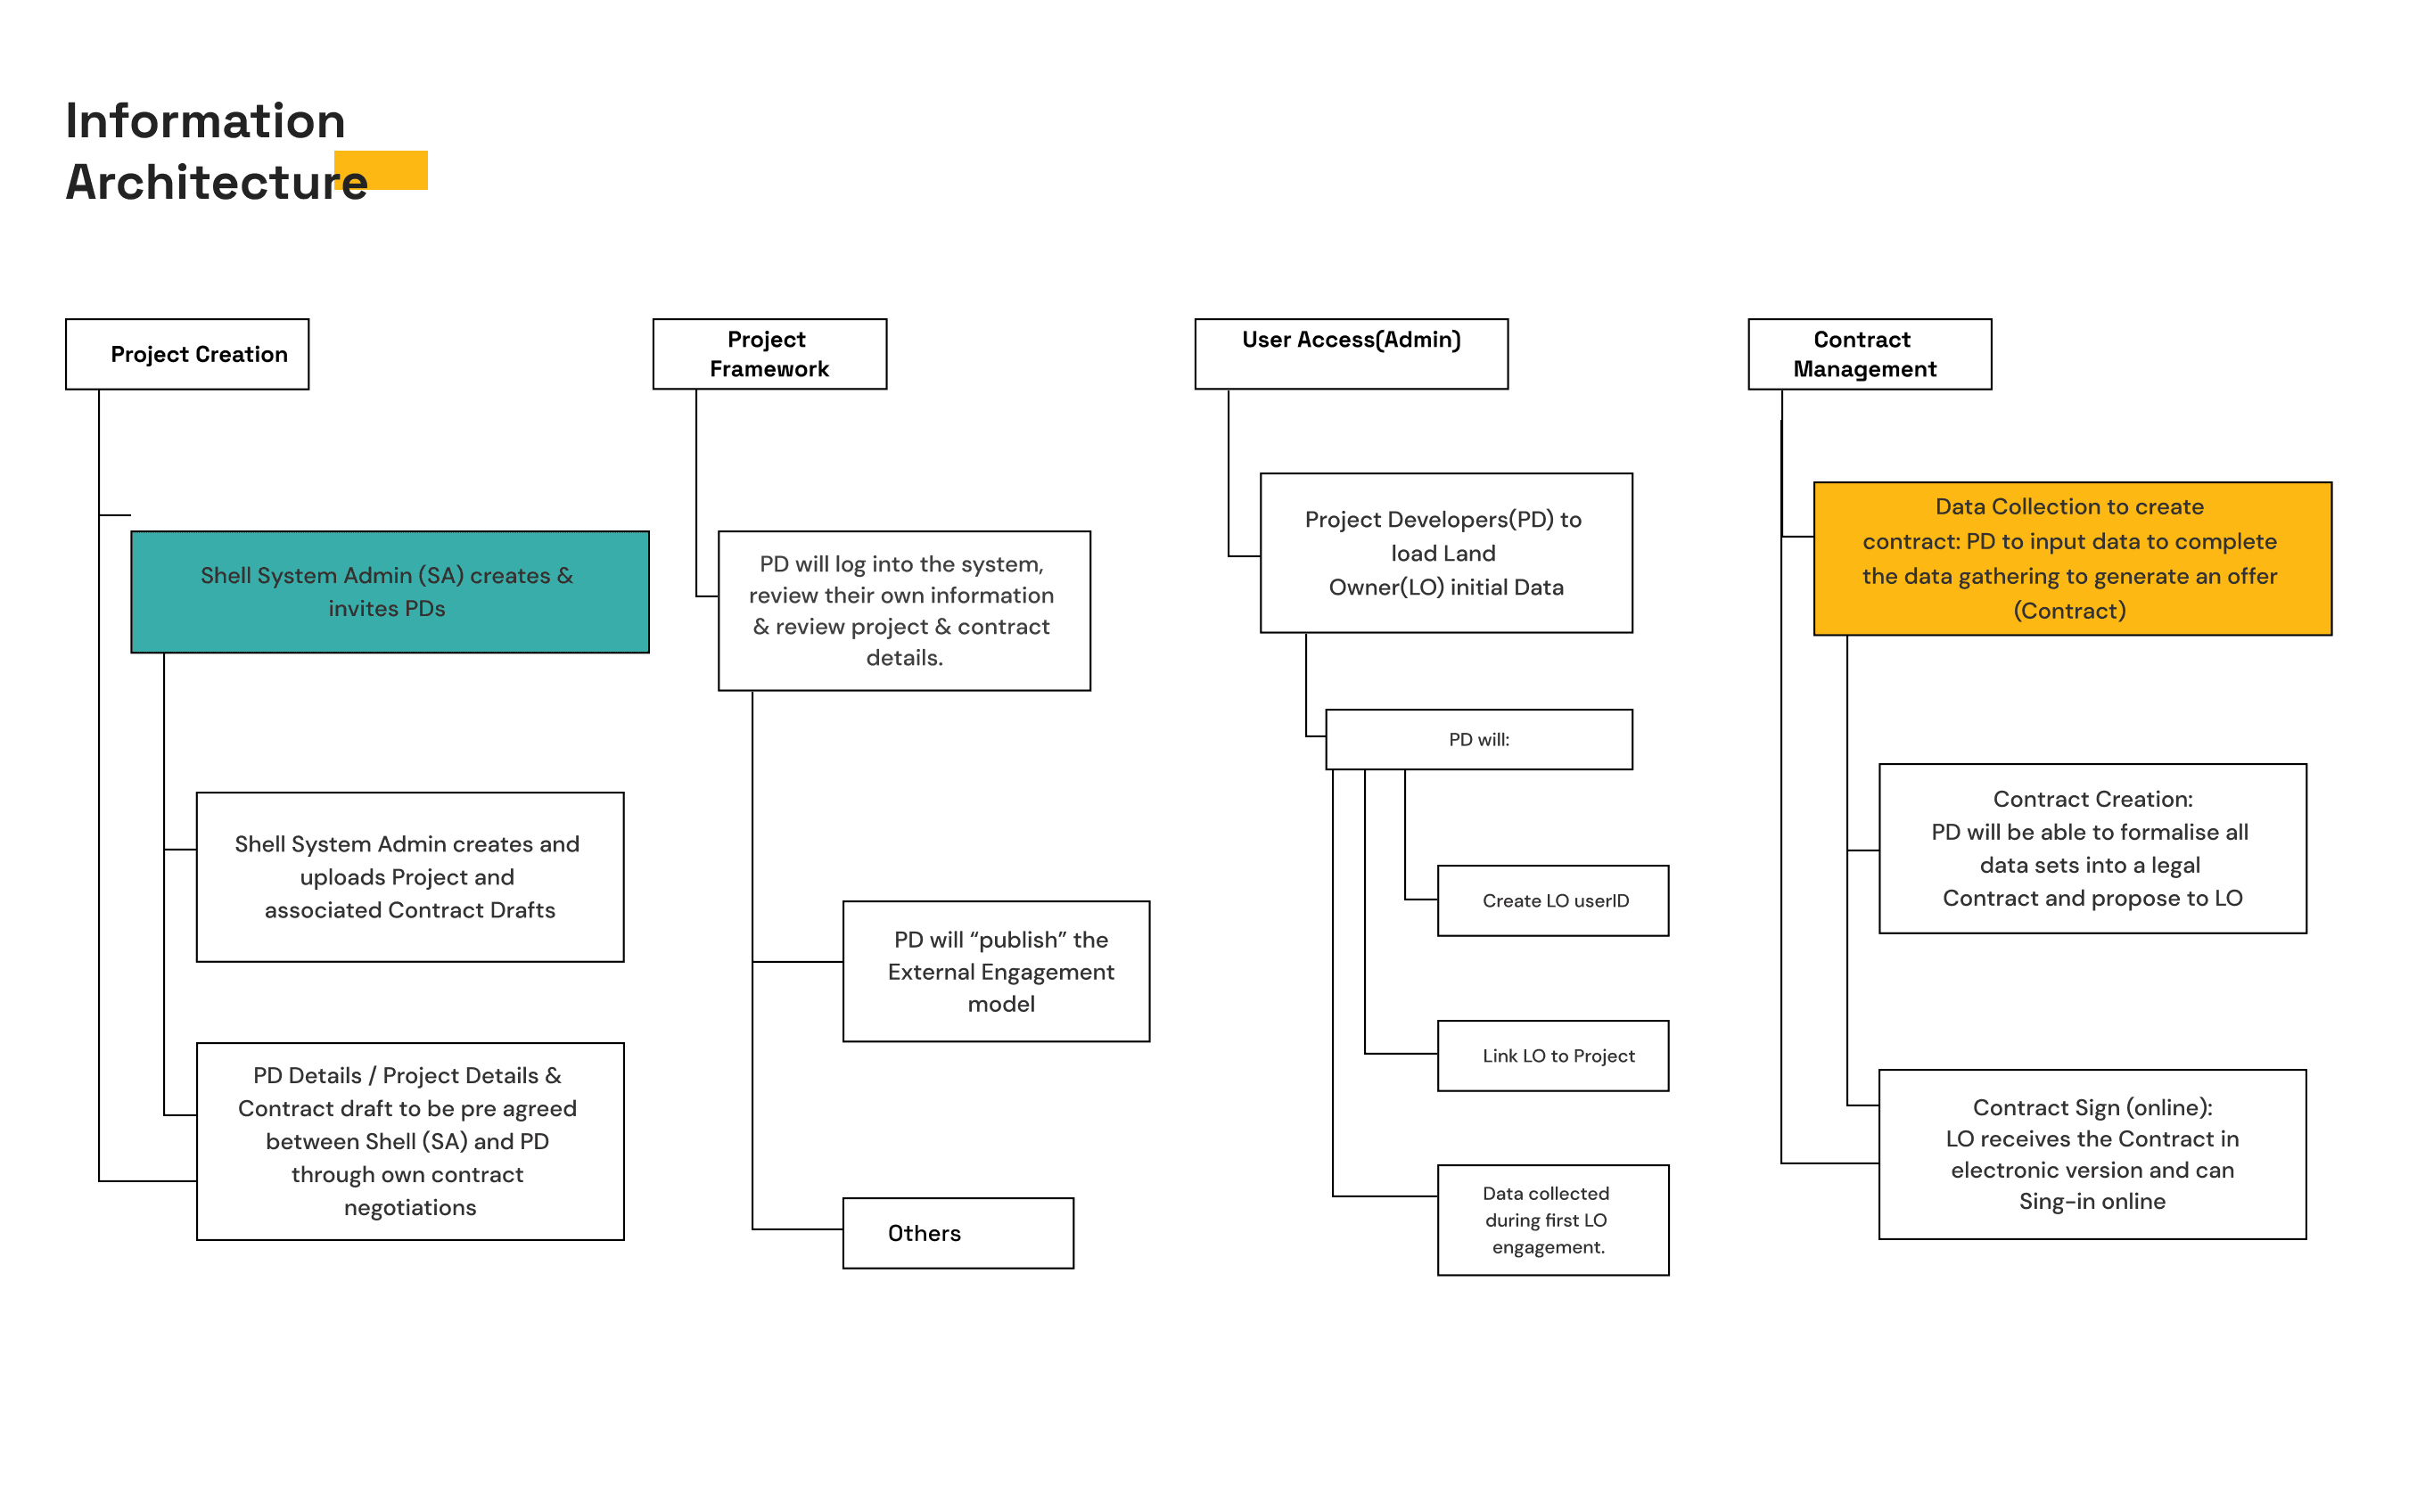
User Flow
The next step in my thinking process was to understand and map out the journey of the user through the platform.
This flow shows the transition from the onboarding part to the in-web features. I segmented the application into four parts to ensure ease of use. The parts include; Home, project, participants and Profile.

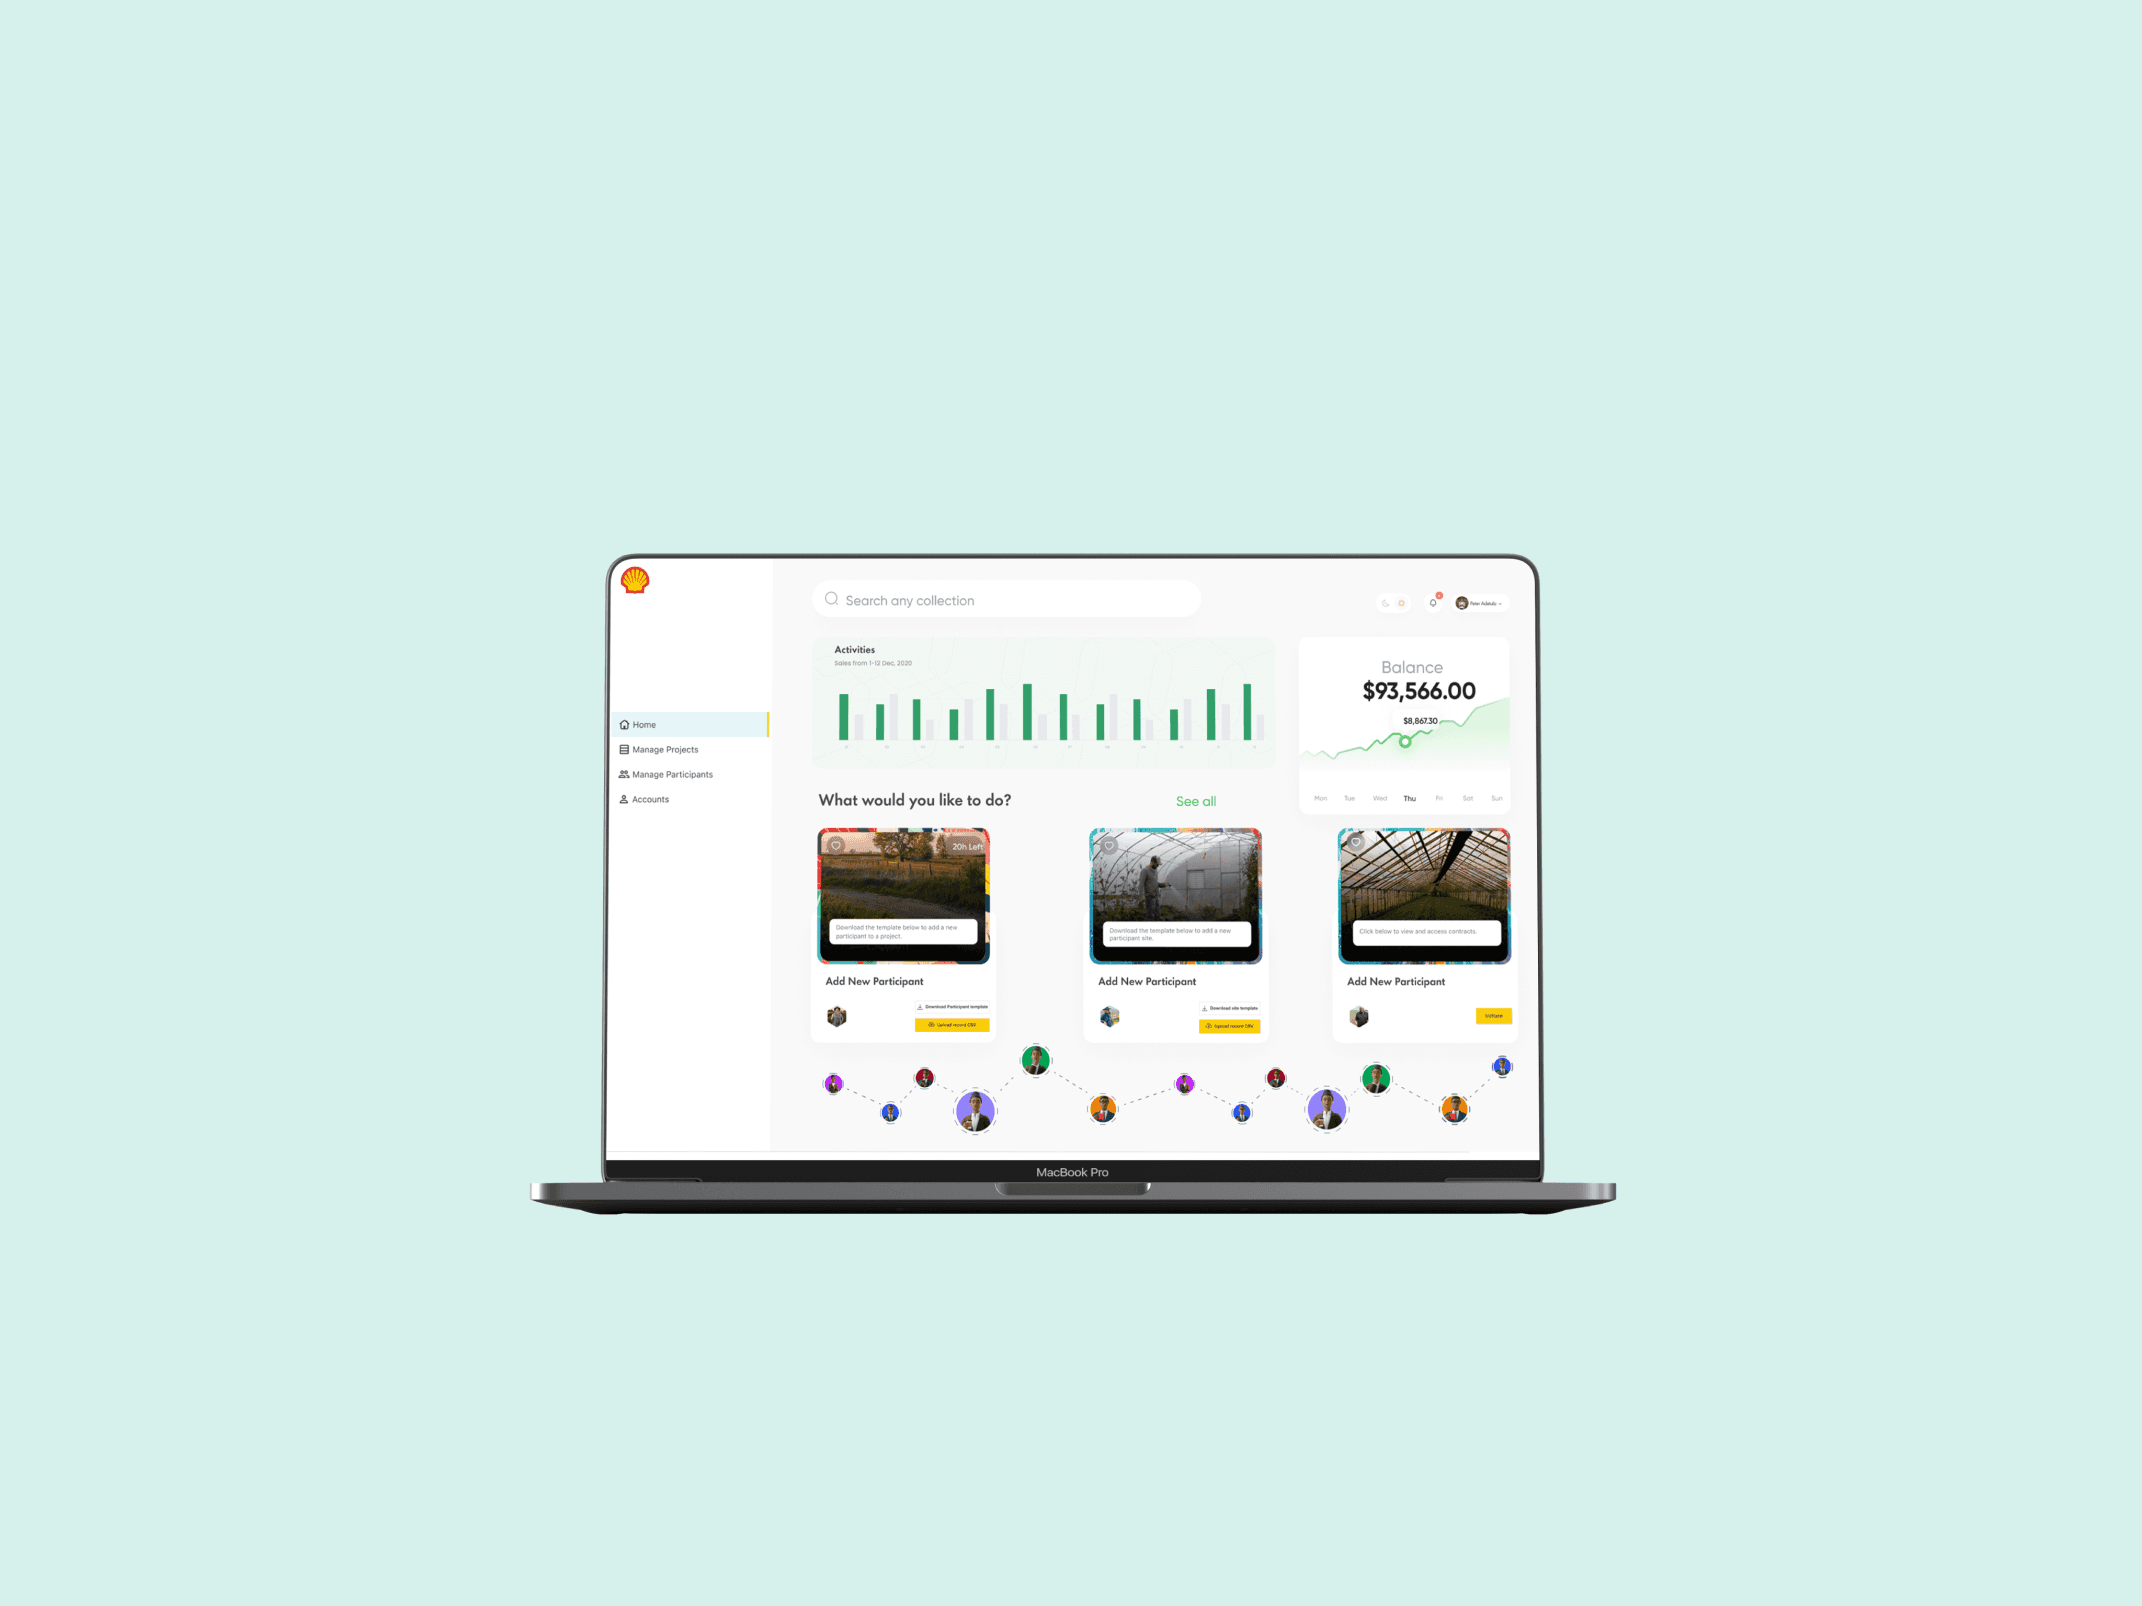
High Fidelity
After the low and mid fidelity wireframes were created. I rolled out the high fidelity designs which brought the wireframes to life.

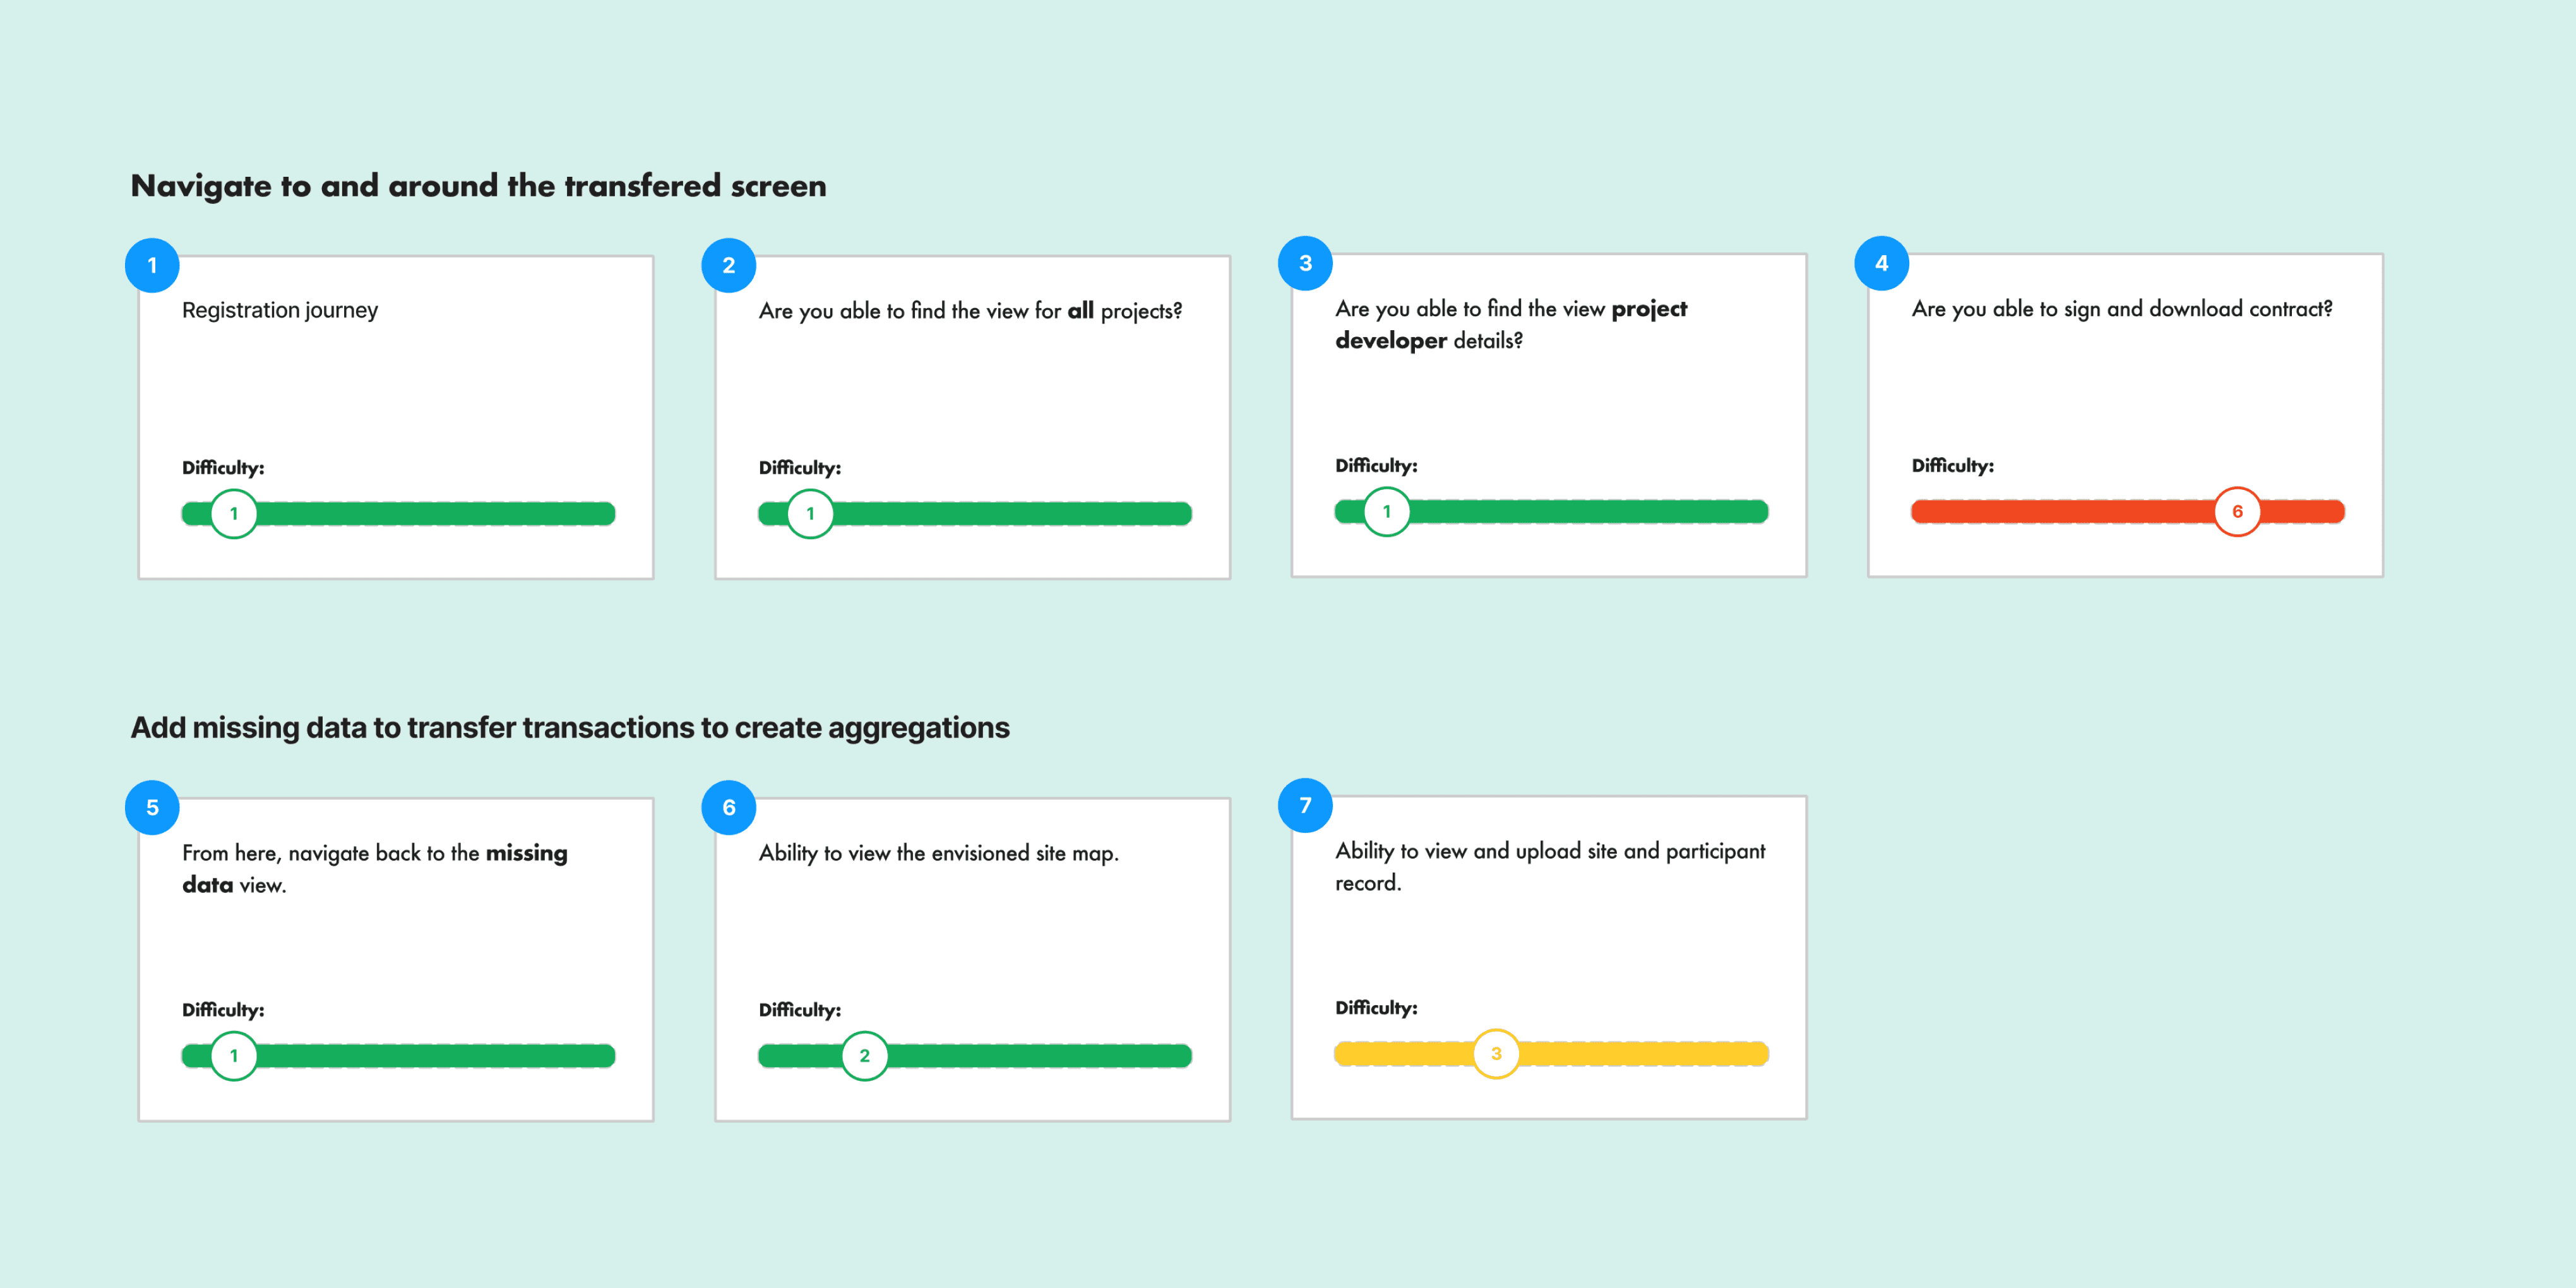
User Testing
I created a clickable prototype of the design to test with users.
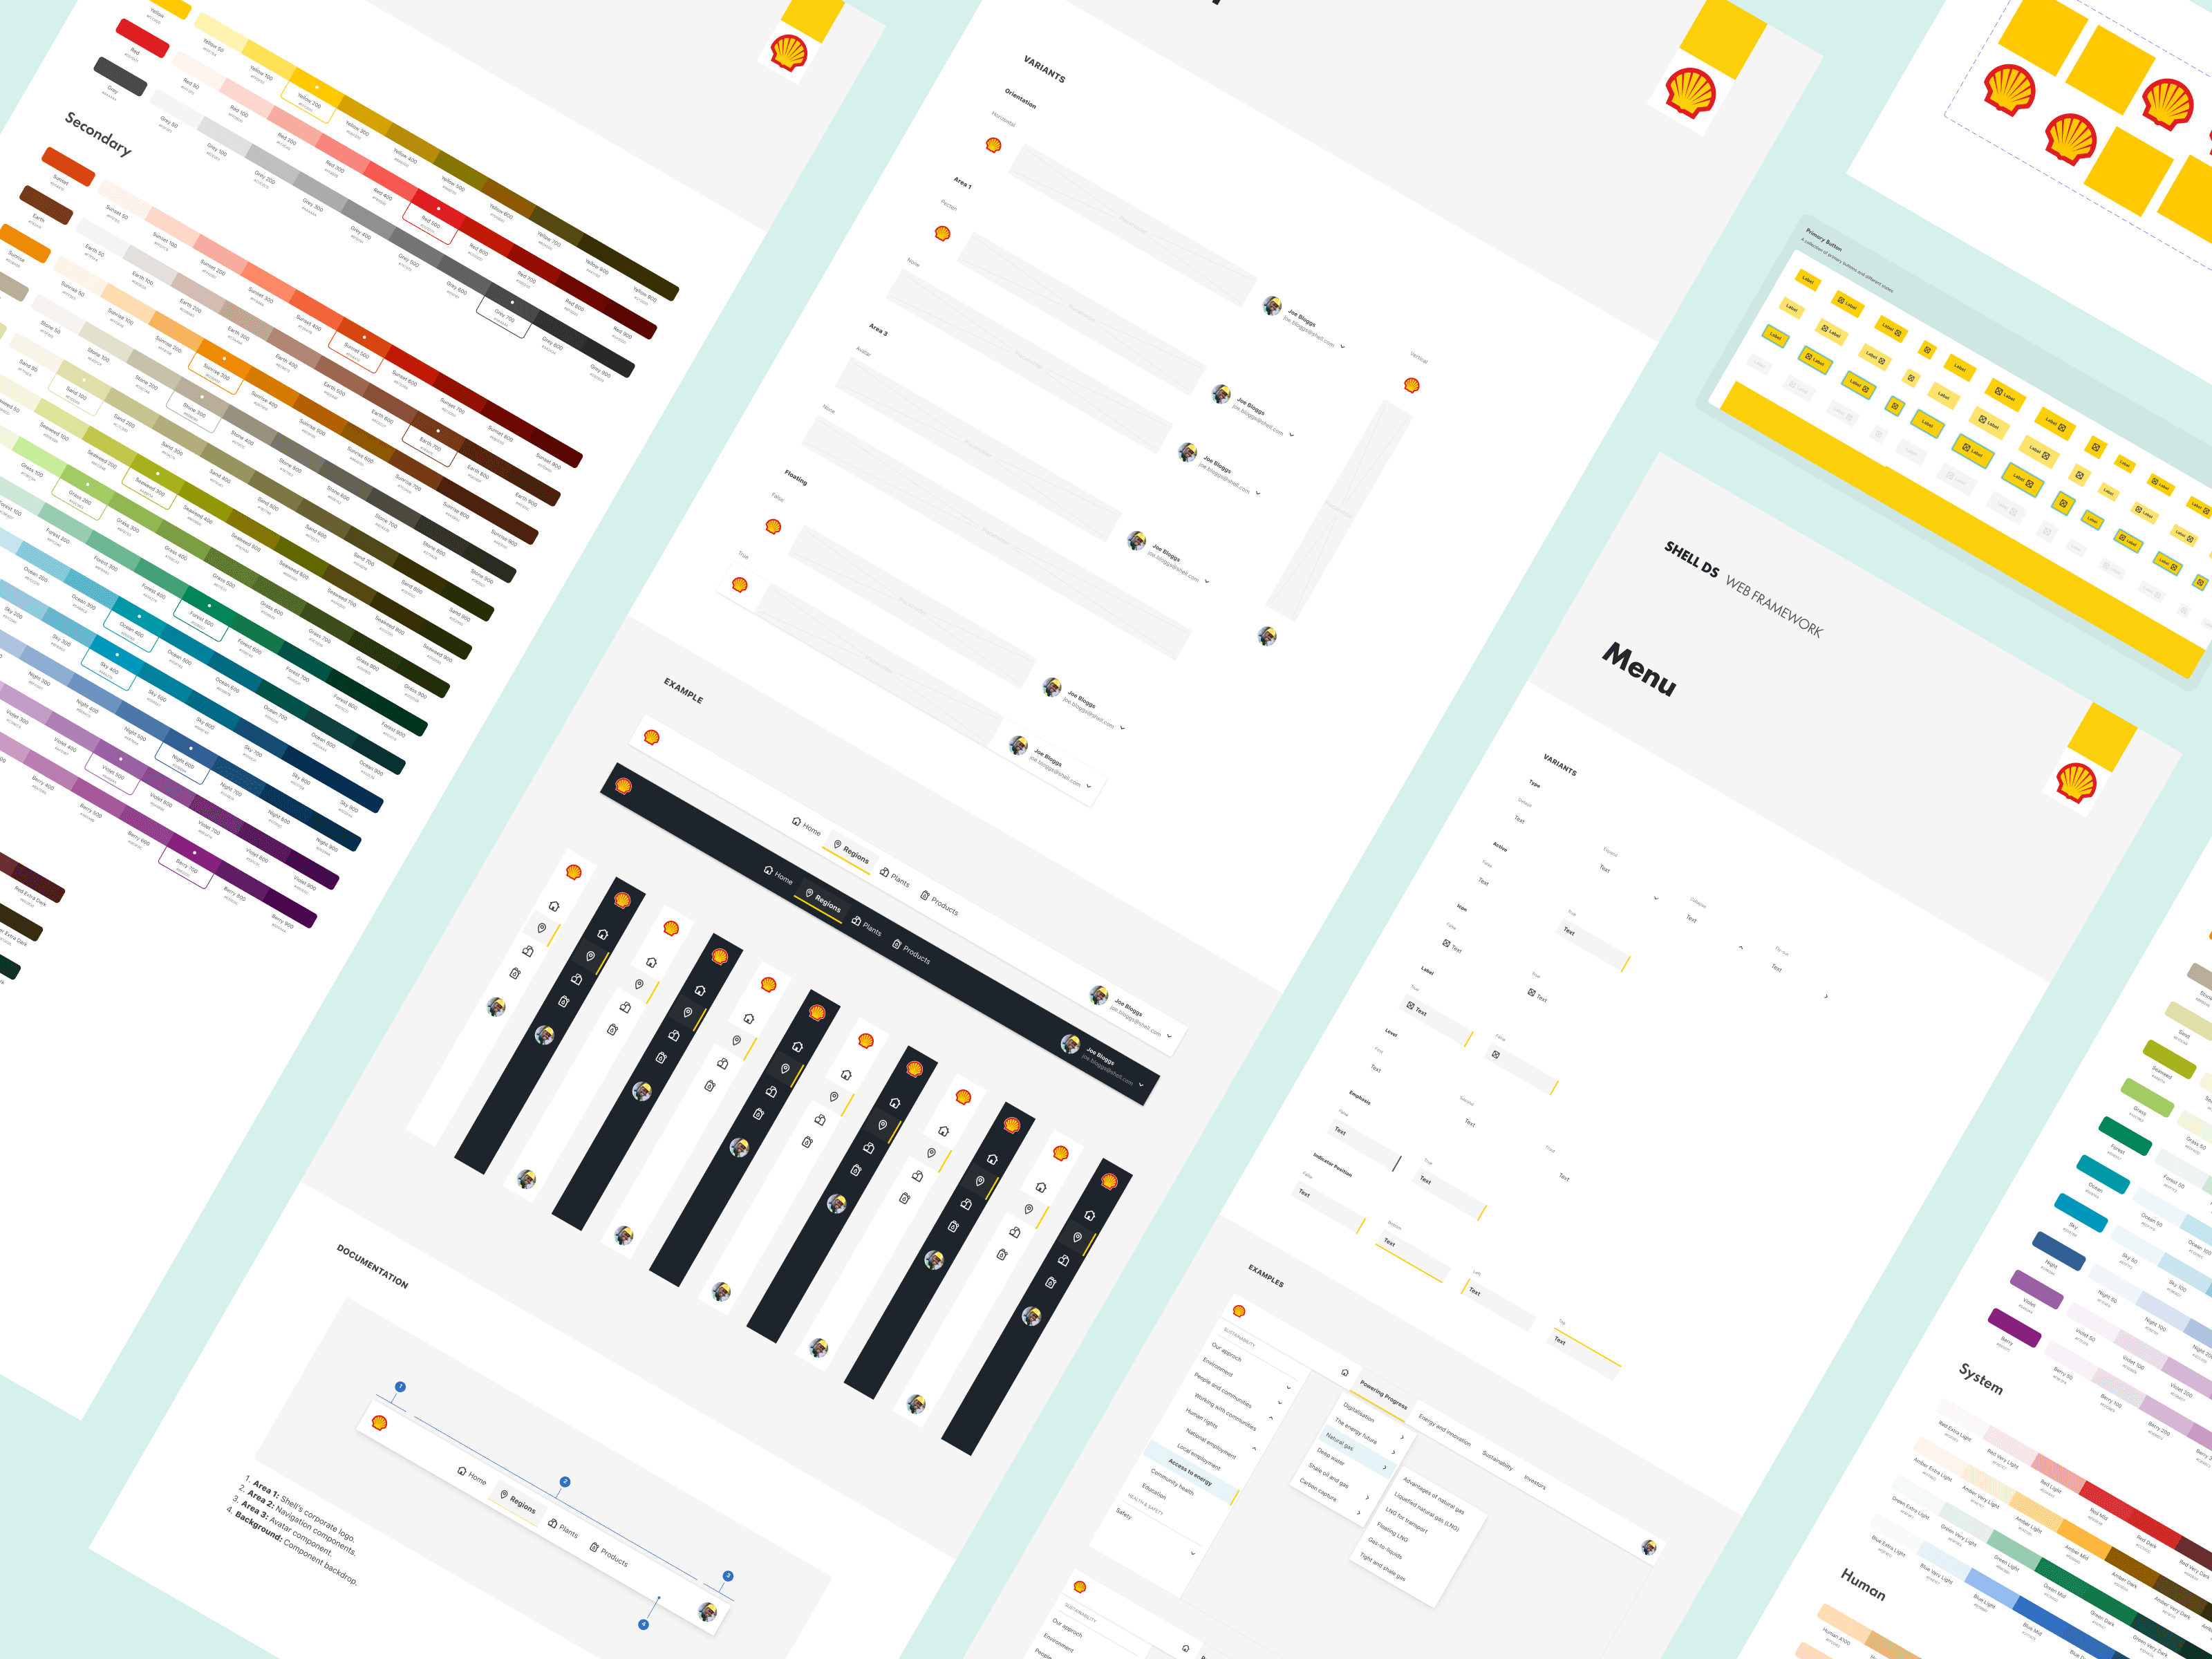
Design Handoff
I prepared a well structured documentation that includes the following:
Specification, Core Elements & Flow
Style Guide (Typography, Color, Types)
Accessible Copy
Shareable Link (JIRA)
I then scheduled a meeting with engineers for handoff and also practise real-time collaboration

Business Impact
Results:
We successfully launched 6 months later and celebrated with the entire team.
We recorded 90% customer satisfaction rate, 15,000+ current users
70% increase in project completion rate
80% increase in transparency rate between land owners and project developers.
This project not only addressed immediate challenges but also laid the foundation for continuous improvement in collaboration, efficiency, and compliance.
Challenges:
Team doesn’t understand and not ready to follow UX practises, but i was able to champion user experience and advocate for design and user research best practice across the organisation, helping to build our design culture and system.
Direct carbon did not provide us with farmers/users to test the platform at the scheduled time
Value for Shell:
The Shell carbon contract hub enables secondary benefits of improving the transparency, managing information and trustworthiness between project developers and land owners.